Living Data
Science Art & Talks
Disclaimers, Copyrights and Citations
Conversations/Index 2010 2011 2012 2013 2014 2015 2016 2017 2018 2019 2020 2021 2022 2023 2024
The experiential process of observation and reflection is key to art and science
and is an essential component in understanding interdependence
of all species and ecosystems, terrestrial and aquatic.
Paul Fletcher Animator
Science Art & Talks
Living Data Program for the 2013 Ultimo Science Festival, Sydney, September 12-21.
Algal fuel living laboratory, 2013 Installation
Supriya Guruprasad, Dale Radford, Bojan Tamburic & Martin Schliep
Professor Peter Ralph is interviewed by Lisa Roberts at the Muse on Friday 13th September 2013.
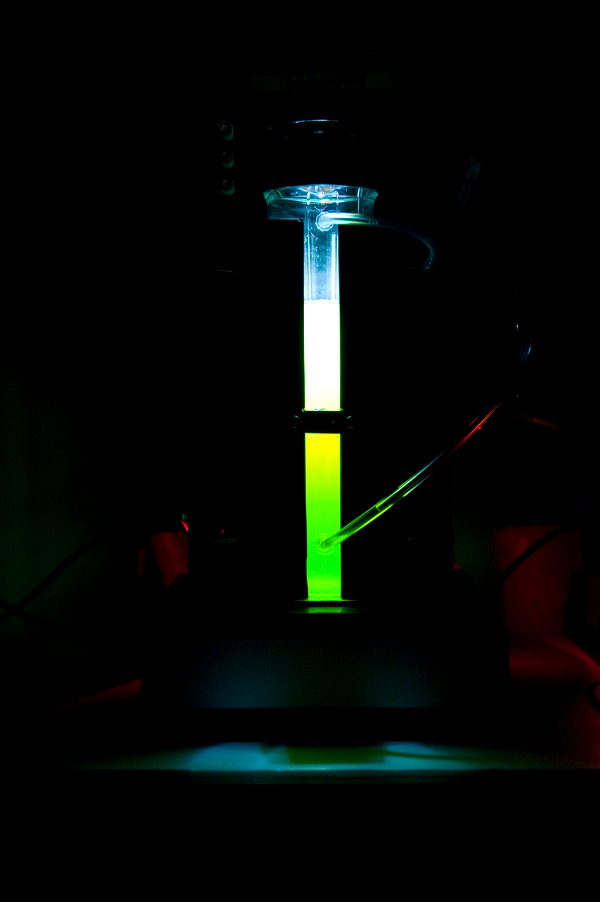
Algal fuel living laboratory 2013
UTS C3 Algal Biofuels Group (ABG). Photo: J. Saad
Algal biofuels are being developed at UTS to deliver the sustainable and affordable transport fuels of the future.
Despite global efforts to harness the renewable energy potential of microalgae, low-cost, high-yield and high-efficiency commercial algal biofuel production remains elusive.
Professor Peter RalphC3 Executive Director
The human race is dependent upon crude oil for transport. This exhaustible, environmentally damaging resource has fuelled our current population expansion for over a century, but has left devastating legacy consequences for our climate. Proven oil reserves are now diminishing rapidly and, for the sake of future generations, an alternative sustainable fuel must be found. Biofuels are part of the solution and algae are the most promising source of transport biofuels globally. Algae are tiny marine 'bugs' that use sunlight, seawater and waste carbon dioxide to capture light energy by photosynthesis. This energy is stored in the form of algal oil, which can be processed into petrol and jet fuel. Algae can be grown anywhere in the world and harvested throughout the year. Unlike land-based biofuel crops, such as corn and sugarcane, they do not compete with food crops for agricultural land or fresh water. They also act as a natural sponge that soaks up excess carbon dioxide from the atmosphere. Further research is required to turn algal oil into a commercially viable product.
Here at UTS, we have built a dedicated team of international researchers to investigate algal oil production. We use living laboratories (bioreactors) to discover the best conditions for algal growth, and to encourage algae to produce more oil. Our research aims to advance the development of a sustainable, affordable and available fuel for the future.
Supriya Guruprasad, Dale Radford, Bojan Tamburic & Martin Schliep
UTS C3 Algal Biofuels Group (ABG)
For more information, please contact:
Dr Bojan Tamburic (Bojan.Tamburic@uts.edu.au)
Dr Martin Schliep (Martin.Schliep@uts.edu.au)
Prof Peter Ralph (Peter.Ralph@uts.edu.au)
Notes for exhibition designers:
I am just following up on what we spoke about regarding simple conceptual diagrams to engage the public. Please find attached my (very poorly drawn and simple) diagram. I have tried to simplify the whole idea of algal biofuel relating it to Australia. It would be interesting to get an artistic edge on what I believe the whole Algal Biofuel Group at UTS is striving towards. I am happy to explain further what I am trying to show in the diagram. It would be ideal if we could include something like this in the installation. I would be keen to hear your thoughts and suggestions.
Dale Radford, UTS: C3 Algal Biofuel Group
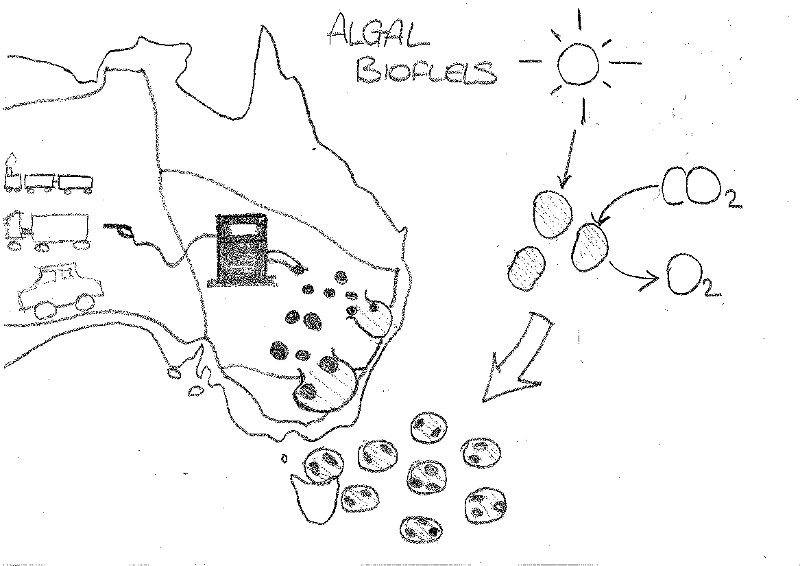
Dale Radford. Concept drawing, 2013
As in the drawings of confident young children, the simple flowing lines are appealing. This quality gives a sense of connection between the picture elements which suggests a dynamic process. Further labels are needed, however, to signify the algae and their lipids, and a plainly written story of how and why lipids are extracted from the algae. Could this work as a comic book or animation?
Aim of diagram:
To provide a simplistic message of the main stages involved in marine algal biofuel production in relation to Australia. It is a flow through from organism to a usable product.
Description of Diagram:
From right-to-left:
Top right:
Marine microalgae (three lightly shaded circles below sun) are microscopic 'plants' that are capable of using the sun's energy and carbon dioxide (CO2) to grow, producing oxygen as a by-product. They are found in large numbers around Australia's coastline.
Bottom (near Tasmania):
Under certain environmental conditions, algae are capable of growing rapidly over a short period of time (sometimes as quickly as a week- 10 days), this event is known as a bloom. During this growth period, another by-product, an 'oil-like' molecule is produced. These are known scientifically as lipids (represented as black dots). Hence, in the diagram, there is an increased number of algae cells and the addition of the oil-like product.
Centre (NSW/Victoria area) to vehicles:
The algae cells are then harvested, where the oil-like product is then extracted from the cell. This can then be converted into a fuel to be used in the transport sector to fuel car, trucks and trains. This process is shown by the black dots (oil-like product) being removed from the algal cell and flowing into the petrol pump and into the (very poorly drawn) vehicles.
Personal overview:
With this diagram I was trying to emphasise major steps of the biofuel production pathway. I found it hard to portray that the algae are in-fact marine 'plants' and grow in seawater. I suppose another area of emphasis should be that fact that Australia is a perfect environment with heaps of sunlight and coastline, which for algae, is a match made in heaven.
Dale Radford
Could more algae be drawin in the ocean?
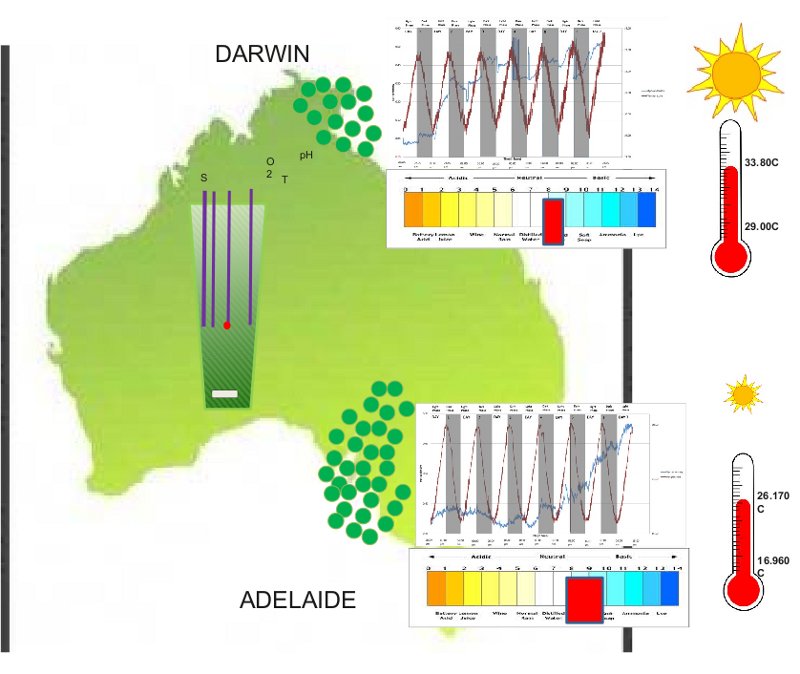
Supriya Guruprasad. Concept diagram, 2013
The map of Australia and the symbols for the sun set the scene for a story that compares results of growing algae for Biofuel in conditions known in Darwin and Adelaide. A caption is needed to fully understand the story, and labels (and possibly other ways of visualising) the graphs and the image in the centre of the continent. Is the scaling inconsistent? The two suns are different sizes, but the thermometers that appear to be associated with these look the same. Could this also work as a comic book or animation?
This concept diagram aims to explain the potential of 'living laboratories' that we have designed at UTS to identify most productive regions for algal biofuel production. Through our 'living laboratory' (Photobioreactor) we mimic natural conditions of actual places to test the feasibility of growing algae for biofuel applications in specific regions.
In the current study, different temperature regimes closely depict the natural temperatures found in Darwin and Adelaide.
The algae tested is the single-celled Nannochloropsis oculata, shown as green circles.
Optical density is used to determine the number of cells using wavelength in light.
Just from seeing clear and murky water I could guess that 'optical density' could be defined (in thefreedictionary.com) as 'a measure of the extent to which a substance transmits light or other electromagnetic radiation'. However it is not so obvious to me why 'cells [are] using wave lengths in light'. Are you referring to photosynthesis?
The change in sun size diagrammatically represents temperature variation. Variation in numbers of cells shows the effect of different temperature regimes on the cells.
Graphs show temperature regimes (red color) and sinusoidal light intensity (white area) which vary both for Darwin and Adelaide. The graphs also depict optical density which is to infer the effect of temperature regimes on the cells.
I would love my concept as an animation, but we need more discussion I think.
I believe that more discussions with artists and designers are necessary for visualising scientific findings. I imagine an animation could be very useful if it can relate actual changes we experience in the physical environment, to changes that are mathematically described. I believe that simple drawings and animations that arise from conversations can be bridges in understanding between many people today who have a strong bias in either art or science. For me the graphs are impenetrable. I also struggle with some of the terminology. I find a definition for 'sinusoidal' that means nothing to a non-mathematical person (me!): 'relating to a sine curve'. Only when I see the shape of a sine curve do I get a sense of what that might mean as a physical experience (like a dance). There was a time (remember Leonardo) when there was no division between the arts and sciences. I believe there is a global movement, in the arts and sciences, towards reconnection.
Thanks Supriuya.
Please get back to me if you have any doubts.
Supriya Guruprasad with Lisa Roberts
Could the two conceptual drawings be combined using the one visual style (with colour?) to connect the two aspects of the one story. Could Dale's visual story-telling approach be combined with Supryia's shematic diagram? Could they come together as a story board (on a strip or poster)? Could it be a pop-up picture book? How many senses can be used to 'read' it? What demographic would this appeal to? Potential investors and consumers?
To evaluate how reciprocity works in Living Data and how our program could be improved, I ask contributors,
What do you most value about our work?
What have you contributed?
How have you benefited?
How could our program be improved?
Bojan Tamburic, UTS C3 Algal Biofuels Group (ABG):
What do you most value about our work?
For a scientist like myself, Living Data presents the opportunity to make my research more stimulating and accessible to the general public. I also have the confidence that all artistic interpretations will stay true to the underlying science.
What have you contributed?
I contributed the Living Laboratory exhibit - a fully-functioning bioreactor where algae are grown for the production of sustainable fuels.
How have you benefited?
Living Data has increased the exposure of my research, generated lots of interest and positive buzz, and opened up the possibility for developing future collaborations and funding opportunities.
How could the Living Data program be improved?
I would have liked to see more interaction with the artists. We could have designed an engaging visual interpretation of the science behind our bioreactor display.
Dale Radford, UTS C3 Algal Biofuels Group (ABG):
What do you most value about our work?
Coming from a purely scientific background I have never really been exposed to the whole idea of making art out of my data. I am just used to making graphs that make my data simple to comprehend. One thing I have most valued has been the discussions I have had with the artists in the Living Data program, about the parallels between the fields and how we go about expressing our common interests. I guess it is all about communication, whether it's through art or through written journals, the message we share can be communicated in all manner of ways.
What have you contributed?
As a member of the Algal Biofuels Group (ABG) at the University of Technology, Sydney, I provided a photobioreactor (PBR) as an installation for the exhibition at the TAFE, Ultimo.
How have you benefited?
For our group (ABG) it was very good to expose our research to the public, mainly with regards to raising awareness about why we are doing our research and to show people in the heart of the city what is being done towards developing sustainable ways for us to live.
On a more personal level, it was a very good experience interacting with the artists, to hear their interpretations of my research. The most interesting part of this for me was the sorts of questions they asked, however basic or complex. Their whole outlook on the research and the reasons for the research was very refreshing to hear and question myself about my personal drivers for doing what I do.
As a scientist I spend a lot of my time and energy collaborating with other scientist in attempts to answer very intricate questions, however, it is not that often that we get a chance to step back and discuss the work with people who have a completely different outlook on the whole research field. Living Data has provided me with new found appreciation these interactions. It is very important for scientists to interact with people outside their disciplines. Who knows what ideas we will be able to generate?
