Living Data
Atrium Archives


Disclaimers, Copyrights and Citations
Presentations/Index 2010 2011 2012 2013 2014 2015 2016 2017 2018 2019 2020 2021 2022 2023 2024
ARCHIVES COMMENTS![]()
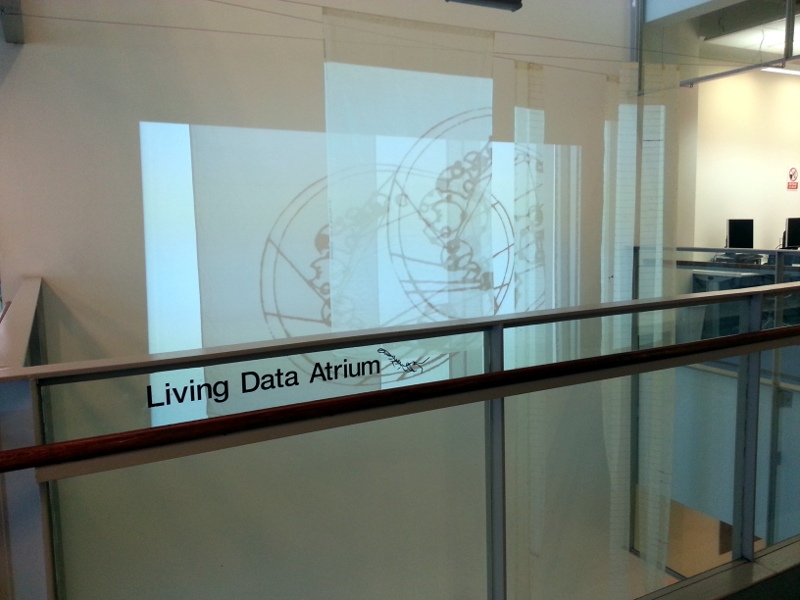
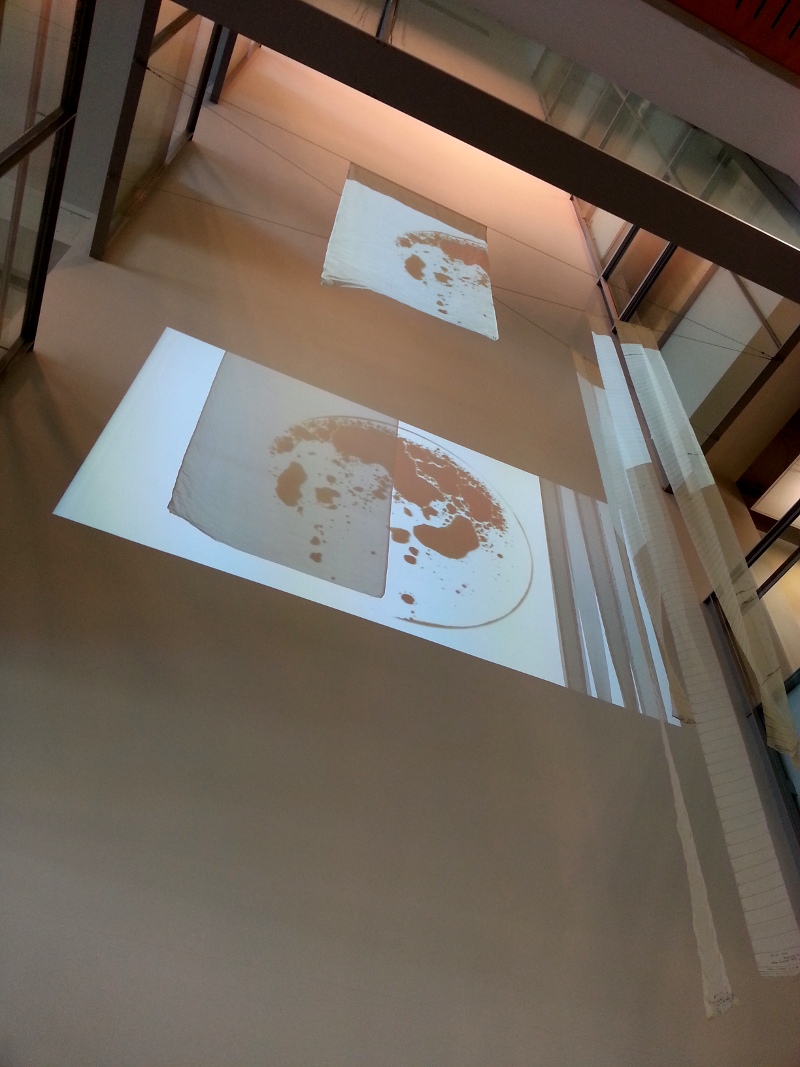
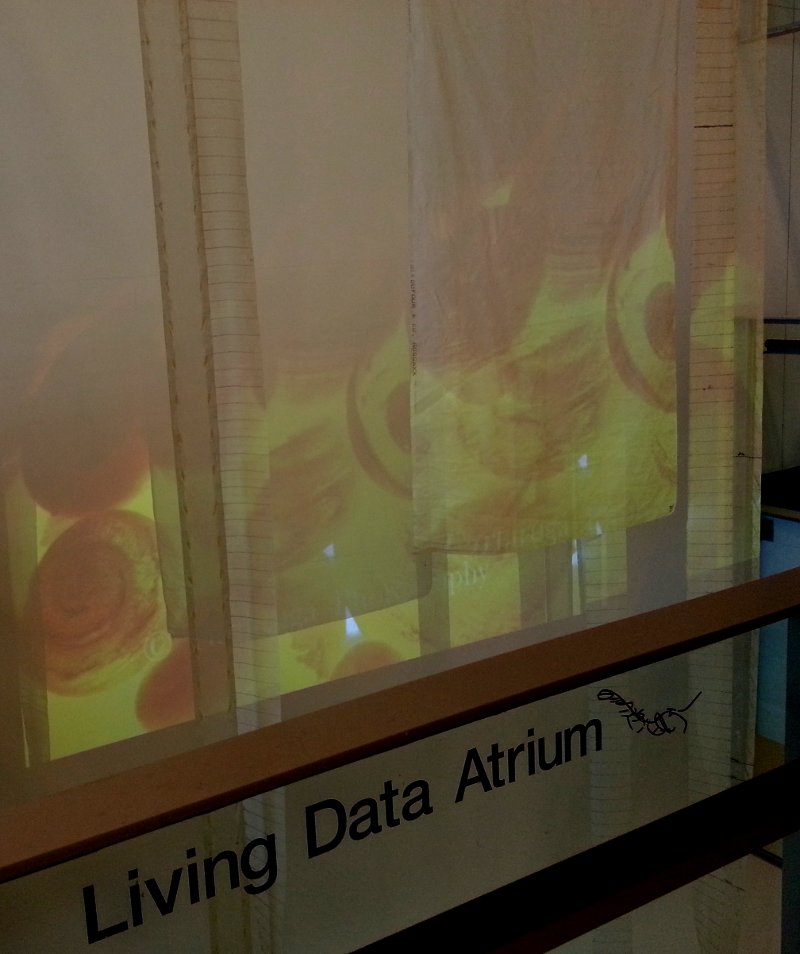
Through 2013, Living Data are projected through silk mesh that once trawled for plankton in the Southern Ocean. Thanks to Living Data Contributors for permission to present their work, and to the University of Technology Sydney (UTS) for hosting the program. Thanks to Australian Antarctic Division scientist Graham Hosie who supplied the plankton mesh. Thanks to UTS Building manage Rod Hahn, for rigging the the mesh in the Atrium. Thanks to BENQ Australia for supplying the data projector.
Follow the links below:
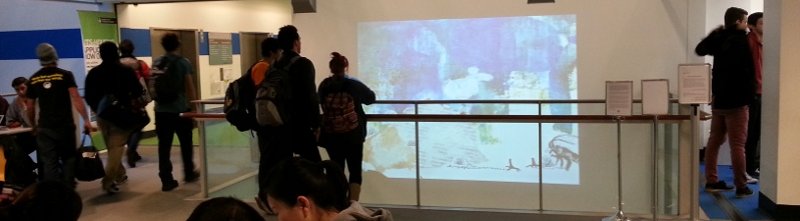
The Living Data Atrium in 2013,
on level 4, building 4 (Science), UTS
2009 POLAR TIME 2013 SPECIES INKED 2013 NATURE WORKS 2013 TANGIBILITY 2013 LIVING DATA REFLECTIONS 2013 DISPEL 2013 PHOTOSYNTHESISING ALGAE 2013 CELL DIVISION 2013 THE CARS THAT ATE PARITY 2013 SEX IN THE SEA 2013 FORESTS OF THE SEA
Polar Time 2009
digital animation, 3min 19sec
Animator: Lisa Roberts
Story/hypothesis: So Kawaguchi
Music: 'Pan' from Six Metamorphoses after Ovid
by Benjamin Britten
Oboe: Stephanie Cooper
Executive production: Ken Wilson
How do polar marine life forms adapt to changing light conditions caused by ice melting?
This animation was made for the 'Helmholtz Virtual-Institutes' research program to understand 'Biological timing in a changing marine environment: clocks and rhythms in pelagic organisms'. The animation visualises life evolving in sync with rhythmic changes in lightness and darkness. The Polar Time program is coordinated by the Alfred Wegener Institute for Polar and Marine Research at the Helmholtz Centre for Environmental Research in Leipzig, Germany. Other participating German universities are Charite Universitatsmedizin Berlin and Carl von Ossietzky University Oldenburg. Foreign partner institutions are University of Padua, Italy and The Australian Antarctic Division (AAD).
Species Inked
Tattoos designed by scientists. 2013
Some scientists have tattoos made from their own designs. In 2013, photos of tattoos supplied by scientists at University of Technology Sydney (UTS), the Australian Antarctic Division (AAD), and California Institute of Technology (Caltec), were sequenced and displayed to show some things that scientists know and care about. Astrophysicist Sarah Gossen explains the significance of her tattoo, of an equation used to calculate the weight of a white dwarf.
How heavy can a white dwarf be?
The equation is an approximation to the Chandrasekhar mass, which is the maximum mass a white dwarf can be - heavier than this, and your dead star will become a neutron star or black hole. I got into science because I love neutron stars and supernovae - you can't really go wrong with crazy magnets, explosions and gravity :D I got it [the tattoo] in my second year of undergrad just before my 20th birthday, when I decided I wanted to go into research!
The number underneath is the arXiv identifier of my first paper - I had been working super hard for ages on it, and I thought it would never be done! When it was finished and put on the arXiv (less than a fortnight before grad school applications were due!!!), I was super proud and knew it was all worth it - so I decided to commemorate it! I've had a few more papers since, but the first one is always special :D
So as cheesy and lame as it is, I got them on my left wrist so I can look at them when I'm hating grad school, and remember why I first got into science, and why I stay in science :)
Sarah Gossen Astrophysicist, California Institute of Technology, 2013
Nature works
Etchings by Andrea Leighsequenced to music by Benjamin Britten
Nature works 2013
Etchings: Andrea Leigh
Music: Pan from Metamorphoses_after_Ovid
by Benjamin Britten
Oboe: Stephanie Cooper
Video: Lisa Roberts
High temperature extremes are predicted to increase in both intensity and frequency. Science is practised to understand how the living world works and how it can be sustained. Etchings are made that express a sense of being part of the changing living world.
The living world stops me in my tracks - making art is my way of trying to articulate the wonder I feel every time my feet hit the soil.
Natural forms and the processes that shape them inspire my work as a scientist, educator and artist. Since a childhood spent surrounded by eucalypt bushland, a sense of wonder and curiosity have inspired me to understand how nature works. By drawing and printing I reconnect to my experience of being in the living world, while doing science connects me to a global community of people who share my desire to know about the natural environment and care about sustaining it.
I am a plant ecologist in the School of the Environment at the University of Technology, Sydney, where I research and teach. I am fascinated by the relationship between plant structure and function and compelled to understand particularly how plants survive extreme heat stress. High temperature extremes are predicted to increase in both intensity and frequency in the future and we don't yet know how plants will adapt to cope, nor if all of them will. I focus on desert and semi-arid environments, where organisms often live on the edge of biological tolerance, something that fascinates me. To support theoretical and laboratory predictions, I am a strong believer in field research, which more closely represents how organisms respond to stress in their natural environment.
I took an unconventional road to becoming a science academic at UTS: a BA (Visual) was followed by several years traveling in Africa and Europe, then returning to university as a mature age student to do a BSc (Hons) and PhD in Ecology, Evolution and Genetics. Although apparently contrasting educational pathways, I see science and art as being entirely complementary, one informing the other on many levels. As a tertiary educator, I love nothing more than bringing students, many of whom have never been outside the city, into the environment to learn about it by experiencing it. The aesthetic beauty and physical presence of the landscape pervade the senses and, for many students, provide the entry point for learning about the environment. The most rewarding experience for me is to hear a student say: now I understand.
Dr Andrea Leigh 2013

Making art is my way of trying to articulate the wonder I feel every time my feet hit the soil.
Natural forms and the processes that shape them inspire my work as a scientist, educator and artist. Since a childhood spent surrounded by eucalypt bushland, a sense of wonder and curiosity have inspired me to understand how nature works. By drawing and printing I reconnect to my experience of being in the living world, while doing science connects me to a global community of people who share my desire to know about the natural environment and care about sustaining it.
Tangibility Animation by Rachael Priddel with sound by Rhys Melbourne, 2013
Touch is important. It is our connection to the world. In his work, The Five Senses, philosopher Michel Serres describes the skin as the resting place of the soul. He explains that our concept of self is only truly knowable through physical connection to the world.
Tangibility is the first iteration of a practice based research project exploring this philosophy. The project aims to use physical image making practices to create synaesthetic representations of touch. The imagery itself was created using natural phenomena, relative density and evaporation, connecting our environment to our individual perception.
The stages of the project have presented interesting correlations between the experience of the self and the nature of the greater world. Imagery suggests subjective sensory responses to physical processes. The work explores turning points, force and resistance playing off one another, on the smallest and the grandest of scales. In seeking a way to represent our own physicality, Tangibility reveals how we are defined by our connections to our world, celebrating the strengths and considering the fragility of our world, and by extension ourselves.
Tangibility was produced as part of the Masters of Animation at the University of Technology, Sydney.
Rachael Priddel 2013
Rachael Priddel is a recent UTS graduate of Design. Her experiments in stop-motion animation visualise saturation and evaporation in various liquids under a range of conditions. Forms evolve that suggest microscopic and telescopic views. The animation may be seen as a metaphor for limits to natural growth as changes and transformations suggest plants and animals retreating or being displaced.
Living Data Reflections Photos by Arjun Verma, 2013
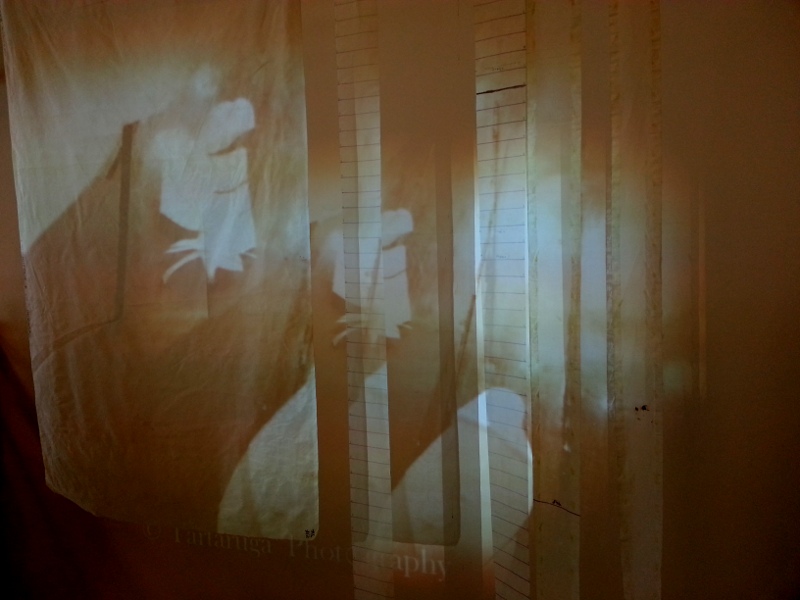
Detail of Pelagic, 2013, installation by Leanne Thompson photographed by Arjun Verma. Arjun is a PhD science student at the University of Technology, Sydney. He came to the 2013 Living Data exhibition at the Muse, photographed the art work and further developed his images. See more on his Facebook pageand at Tartaruga Photography.
Detail of Midden, 2013, installation by Melissa Smith photographed by Arjun Verma. See more at Arjun's Facebook pageand at Tartaruga Photography.
Dispel Animation by scientist Tim Senden with direction by artist Melissa Smith, 2013

Just as the shell of a pteropod appears, it cascades away, the illusion dispelled.
An X-Ray microCT scan of the shell of a pteropod - Limacina helicina antarctica (sea butterfly) - is animated to represent the threat faced by these marine creatures due to ocean acidification. As the seas absorb more carbon dioxide, their chemistry changes. Carbonate ion levels decline and this element is an important building block for the pteropod's shell. As a vital link in the marine food chain the demise of the pteropod will have a compounding effect on the web of life.
Dispel 2013
digital animation, 2min 30sec
Animator: Professor Tim Senden
Music: Thecosomata
Composer - Hannah Wolfhagen
Viola - Hannah Wolfhagen Piano - Michelle Els
Creative Direction: Melissa Smith
Photosynthesising Algae Underwater photograph by Bill Gladstone, Monday 8 July - Sunday 21 July 2013
Image: Bill Gladstone
University of Technology, Sydney
A symbiotic relationship exists between a plant and an animal.
The giant clam's mantle tissues act as a habitat for the symbiotic single-celled dinoflagellate algae (zooxanthellae) from which it gets nutrition. By day, the clam opens its shell and extends its mantle tissue so that the algae receive the sunlight they need to photosynthesize.
Wikipedia http://en.wikipedia.org/wiki/Giant_clam Accessed 11 July 2013
Cell Division. Animation by Lisa Roberts, Monday 1 July - Sunday 7 July 2013
Animation: Lisa Roberts
Data: Australian Antarctic Division
Executive Production: Ken Wilson

In a healthy organism no cell is independent of the others.
Senior Science for High School Students
Professor H. Messel University of Sydney, 1967. p. 16-23
Photographs by Paul Sutton, 2013 Monday 14 June - Sunday 30 June 2013

In the future, I think we will look back at ourselves with disbelief that we once drove around in cars with such little concern for the impact we made on the environment.
The Cars That Ate Parity explores cars and the urban environments we share with them. It emerged out of a practice of making photographs while not looking at the camera or through the camera. Given the ubiquity of cars in our world it is no surprise that they appear in photographs made while not looking. What is surprising is I would never have otherwise thought to photograph cars. I don't drive a car; I prefer to walk.
While cars help us to connect with the world by transporting us from A to B they also disconnect us from the world during the journey.
After I decided that cars would make an interesting subject for visual investigation I focused on filling the frame with their shapes, forms, contours, colours and reflective surfaces. On another level, my compositions also make connections between mechanical and natural systems.
Seeing these photographs projected into the Living Data Atrium is wonderful. I love the play of light and the way the images are fractured within three-dimensional space. It reintroduces a sense of discovery into the act of viewing photographs.
Circling, Spiralling, Crossing lines...
describe natural systems...
physical, biological, emotional.
Glacial ice melts.
Krill stir the sea.
Diatoms drift.
Connectivity is felt and measured.
Antarctic sea ice pulses...
like breath.
Water energy flows.
Water molecules freeze and thaw.
The circumpolar current spins.
Cold bottom water spirals from Antarctica.
Nutrients are drawn up...
by krill and ocean currents.
Krill release eggs.
Sea levels rise.
Oceans warm.
More CO2 seeps into the water...
than many creatures can bear.
CO2 acidifies water.
Natural balance between plants and animals...
is tipping.
Human hands create...
to suit human desires.
Plants of the land and sea create...
the oxygen we breathe...
Is the problem human?
Anthroposcene?
Can the solution be human?
Can life as we know it adapt...
to increasing variability in temperature?
Words: Lisa Roberts with Sue Anderson and Steve Nicol
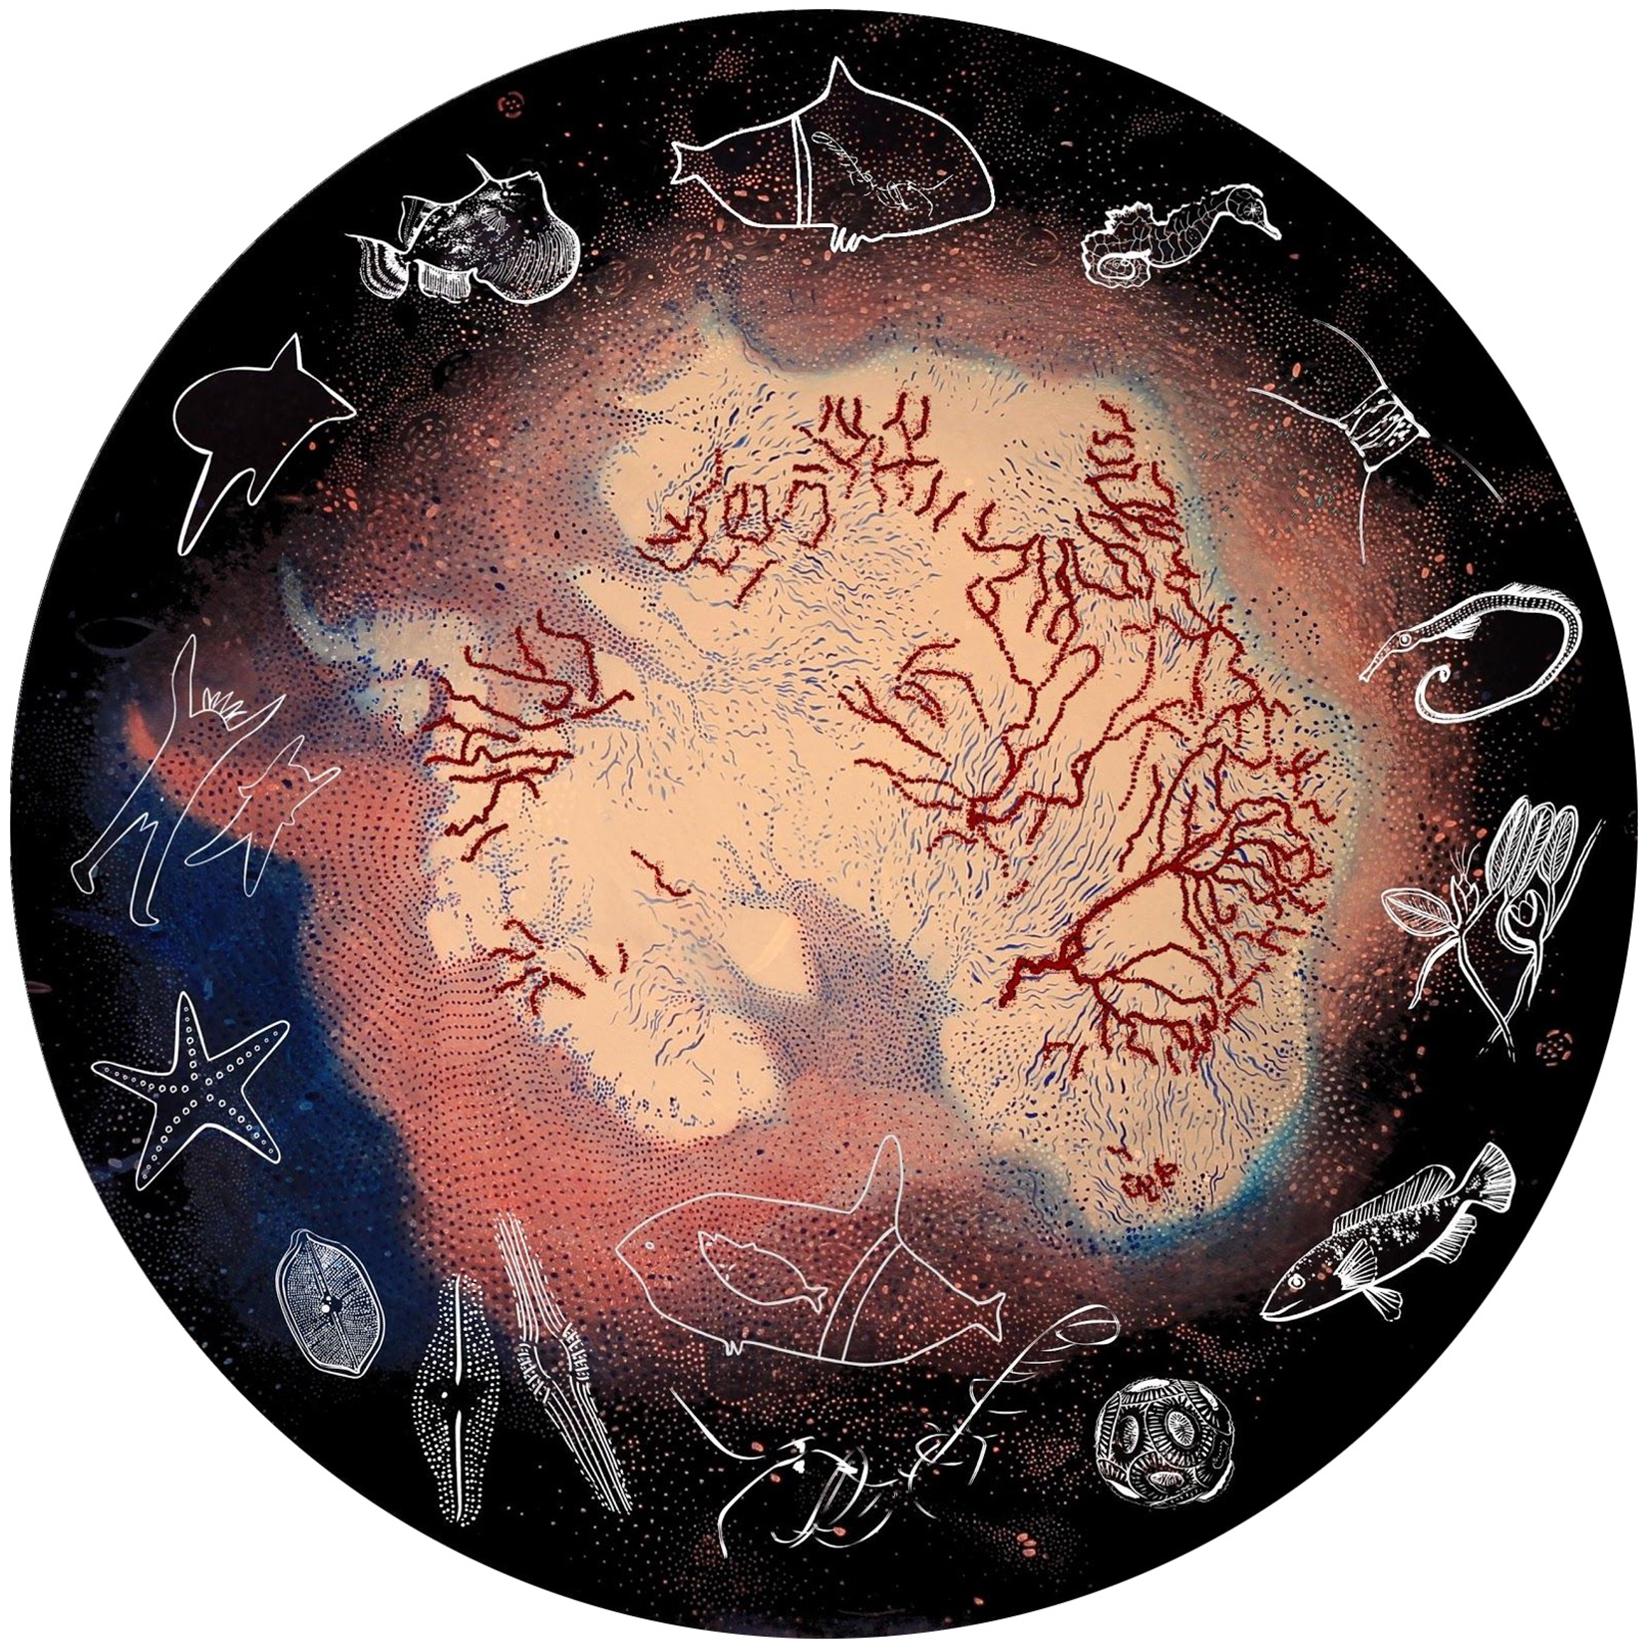
Sex in the Sea is an iteration of Oceanic Living Data, an animation that evolves, like a scientific model, to reflect current knowledge of the global ecosystem. The title comes from William Gladstone, Head of the Department of Environmental Science at the University of Technology, Sydney (UTS), who regularly gives a public lecture of that name. The animation and the talk contribute to understanding climate change through art and science. Key scientific data come from the UTS and the Australian Antarctic Division (AAD). Visual and performing artists from around the world contribute responses to climate change. The story was composed in collaboration with krill biologist Steve Nicol and co-coordinator of Lynchpin, the Ocean Project, Sue Anderson.
This animation features animation by Merindah Funnell who was a student at Eora in 2013. Merindah's art is inspired by oceanic and intertidal life forms.

Image for poster from Oceanic Living Data
Iconography/animation Lisa Roberts
Scientific data/hypothesis Martina Doblin
Digital animation cast through plankton mesh.
Photo: Phil Blatch
Full credits
Installation Living Data at Eora Centre for Aboriginal Studies, Abercrombie Street, Chippendale, Sydney. Wednesday 17 October 12.10pm - 1.45pm

The animation screens in the Living Data Atrium on level 3 of the Science Building, University of Technology, Sydney, from Monday 3 June - Sunday 13 June 2013
Giant kelp forests of the Ocean are disappearing. Forests of the Seaby Malou Zuedemascreens in the Living Data Atrium on level 3 of the Science Building, University of Technology, Sydney, from Monday 27 May - Sunday 2 June 2013

![]() As artist, my aim is to give a sense of being present within the changing environment.
As artist, my aim is to give a sense of being present within the changing environment.