Living Data
Exhibits
Disclaimers, Copyrights and Citations


Living data: how art helps us all understand climate change
By Lisa Roberts University of Technology Sydney
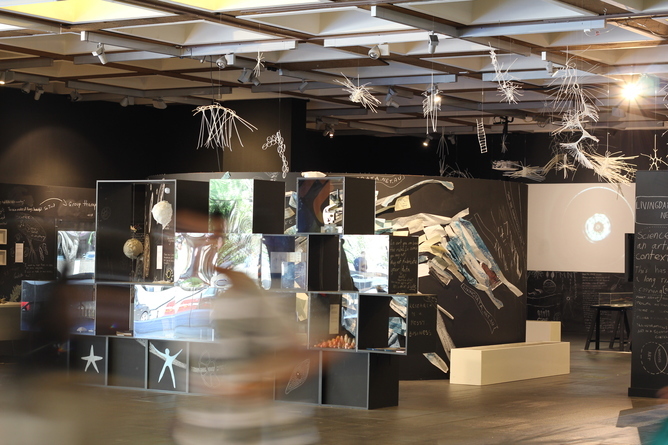
Living Data: Evolving Conversations.
Exhibition and Forum at the University of Technology Sydney, 2014. Curators: Lisa Roberts and Anita Marosszeky.
Photo: Lisa Roberts
We hear so much about the integrity of scientific process and the role of data in driving action on climate change - but what role is there for artists in bringing about changes in understandings?
Science and the arts are often polarised as incompatible ways of understanding the world. That's not necessarily true - and what brings them together is creativity and curiosity.
Creativity is at the heart of art and science and passion drives both as ways of satisfying curiosity and expressing new findings. Science builds a world-view based on currently known facts. Art expresses personal understanding and experience. When a scientific view aligns with lived experience, iconography and story may lead us usefully towards a sustainable future.
The need to understand climate change is urgent. For some people, the facts about climate change don't matter - so we need experiences that stir strong feelings of connection. Artists are leading the way to reconnect methods of analysis and expression in this way. The Living Data program that I lead is one of several initiatives to bring together scientists and artists.
The creative challengewe face is to accurately express the changes happening to natural systems in ways that resonate with feelings of connection. It is not enough to know the science. People process information in different ways, from the mechanistic to the sensory, from Skeptical Scienceto Green Porn. For that reason, we need to make icons which have a dual resonance, that speak to the mechanistic and the sensory.
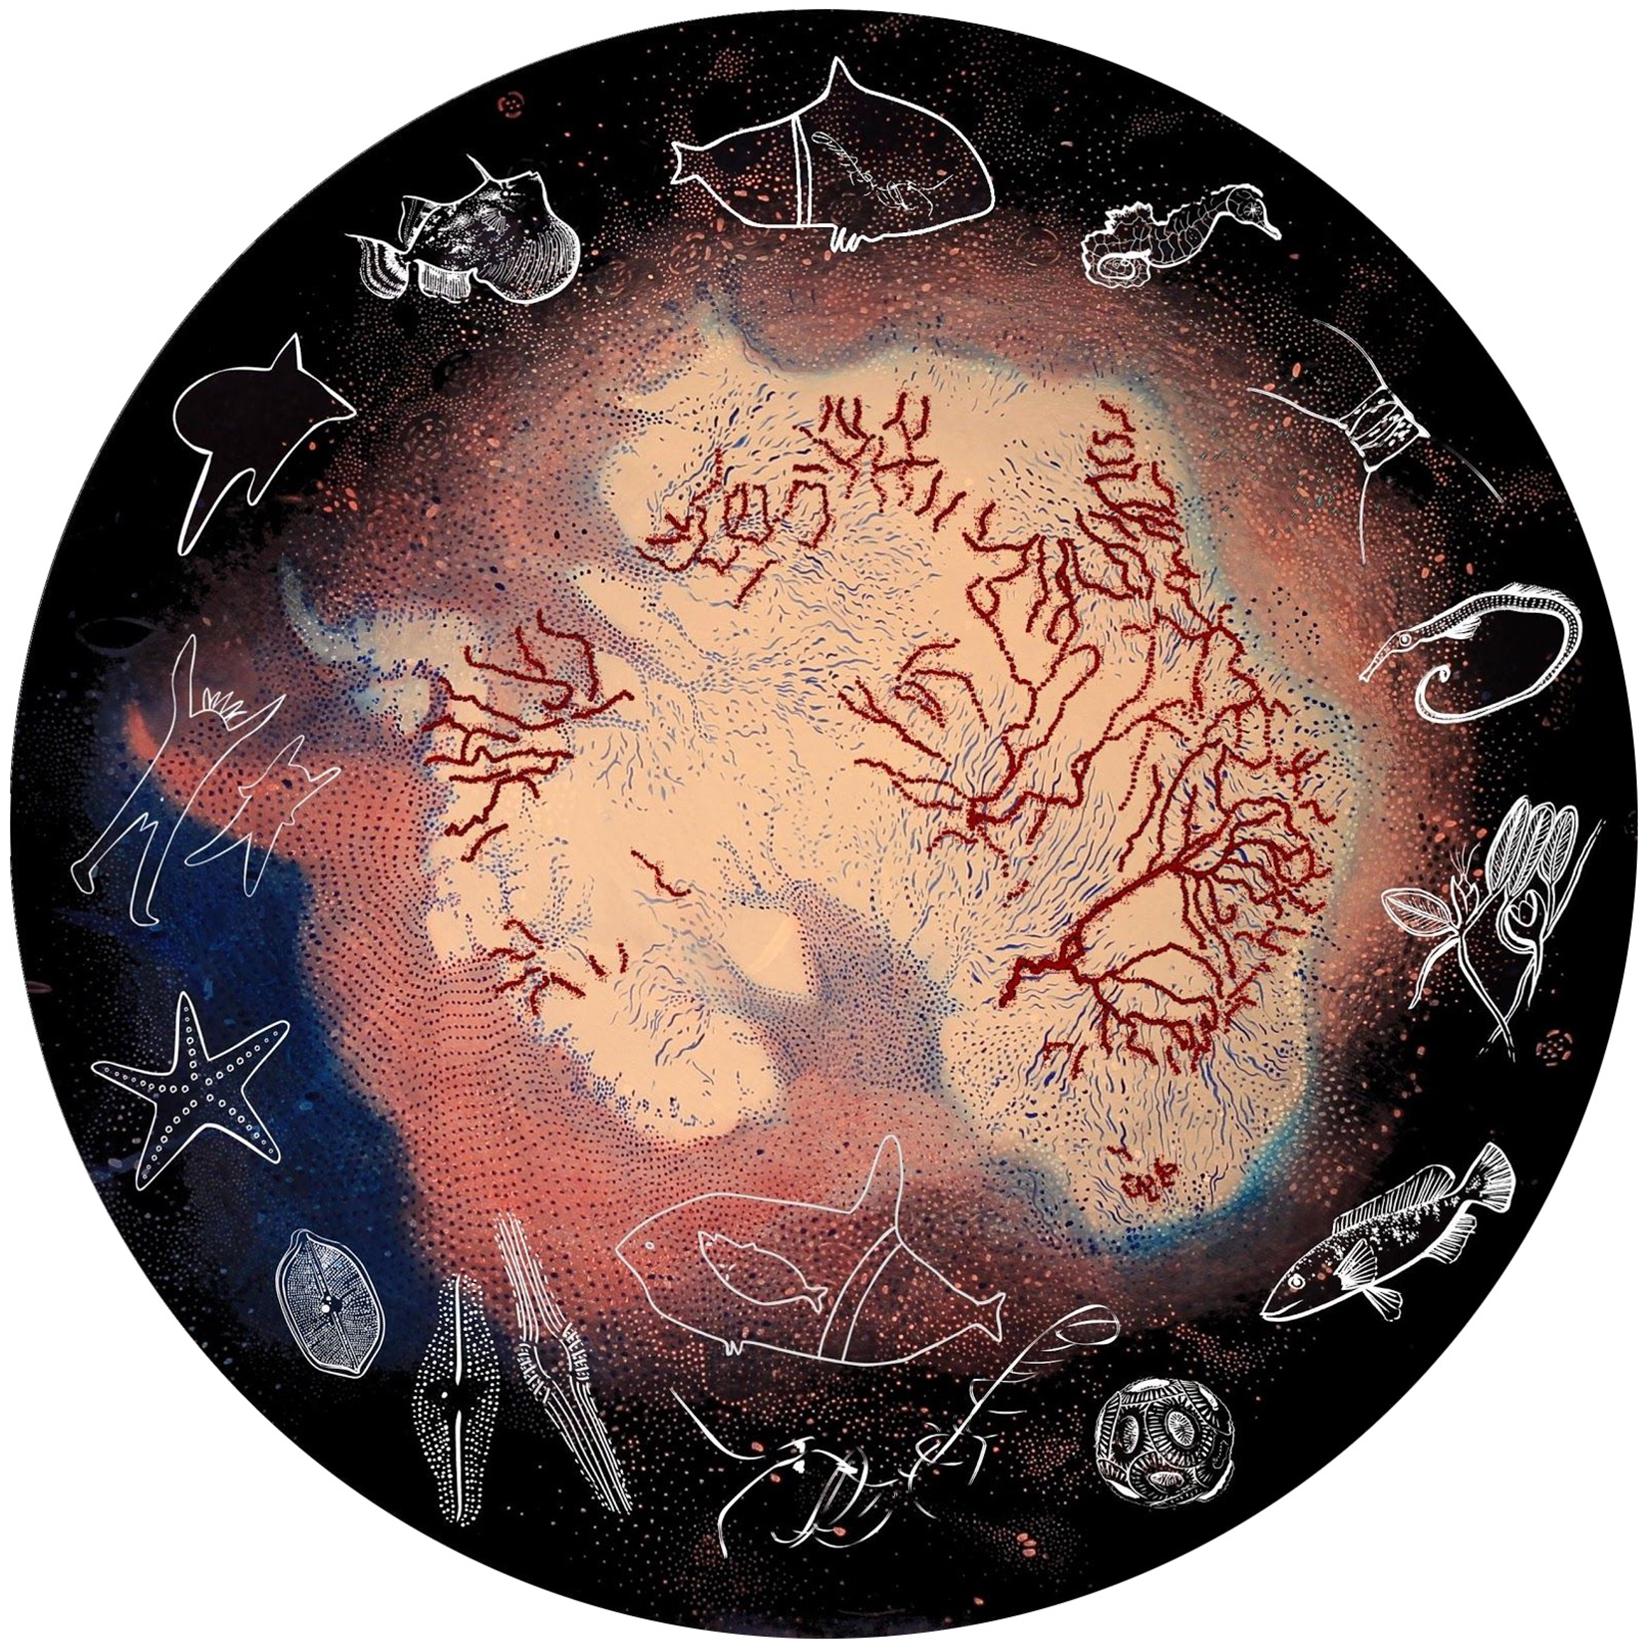
2012 iteration of Oceanic Living Data,
an animated installation that evolves,
like a scientific model,
to reflect current knowledge
of the global ecosystem.
This kind of practice is evolving on a global scale through a network of artist-led programs. Conversations between climate change scientists and artists are led through Lynchpin(Hobart), Sur Polar(Buenos Aires), Cape Farewell(London) - as well as the Living Data program.
The programs are led by people with knowledge and concern about how the natural world is changing and the desire to respond most usefully.
How Living Data works
We link up to share data, iconography and stories to expand our reach beyond our labs and studios. We present online, in conferences, exhibitions, public spaces, and academic, mainstream and social media. As scientist Kirralee Baker notes,"it's not about the story teller but the story to be told".
My role in driving action on climate change is as an artist. My inspiration comes from dance, from my experience of Antarctica- and from 12 years of working with scientists and other artists whose concern is climate change.
A methodology that uses drawing and dance as tools of enquiry is a radical idea for those accustomed to the conventions of the scientific method. But when choreographic analysis is embedded within scientific research, pattern recognition can contribute to some startling discoveries.
Previously unseen behaviour in Antarctic krill is revealedthrough the patterns in mating dances. As are rhythmic cycles of Antarctic sea iceand the relationship between water temperature and the abundance of marine algae.
My practice is animation and my approach is collaborative. In the Living Data program scientists and artists share data, iconography and methodology, to develop new ways of understanding and expressing changes in natural systems. Dance and drawing are tools that help me generate animations that combine the primal forms of circling, spiralling and crossing that I recognise in scientific data and subjective responses.
Iconography developed through art of many forms can embody sensory connection to scientific data. Scientists and artists involved in Living Data conversations develop new material for presentation and publication.

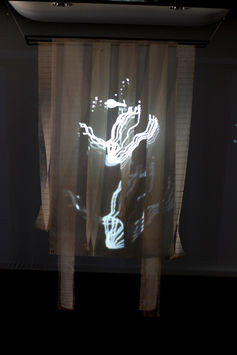
Phytoplankton Micro Installation.
Collaborators: Sue Fenech
and Anita Marosszeky. Living Data
Physical and online presentations, peer reviews and comments make sure shared material is used ethically and lets everyone see how collaborations evolve and have impacts.
Working together
This practice exemplifies the shift towards collective knowledge production that is essential to advance understanding of climate change.
My work is guided by biological and Indigenous methodologies that acknowledge how the natural world works and is maintained. The story I present does not belong to me or even to the association of research participants. Guided by Indigenous Canadian scholar Shawn WilsonI recognise the story as part of the relationships that exist between us and the natural world.
I recognise iconography we use in art, science and systems of belief as primal forms of connection that are available to everyone.
In Australia I've observed that we - as scientists and artists - tend to express climate change knowledge more quietly in recent years, than do our international colleagues. In our current political climate it is vital that we continue to create and present a global conversation through strong works of pathos, beauty, mystery, wit, pragmatism, human interference, techno wizardry, timeless rhythmsand grand symphonic form.
The mix of expressions is vital to inspire and energise new generations of artists and scientists- and to better understand our changing planet.
Read other articles in our creativity series here.
This article was originally published on The Conversation. Read the original article.
Living Data presents artworks, animations installations and forums
Art & Science Talk 12 Sept 2013
Muse gallery, Sydney
Video/Music: Angus and Jason Benedek
Beauty, logic, humour and shock combine to satisfy
recommendationsmade by social scientists to:
Provide understandable, scientific, credible information
Exhibit novel, vivid and concrete imagery
Connect with emotions to inspire care and motivate action
Balance negative and positive information