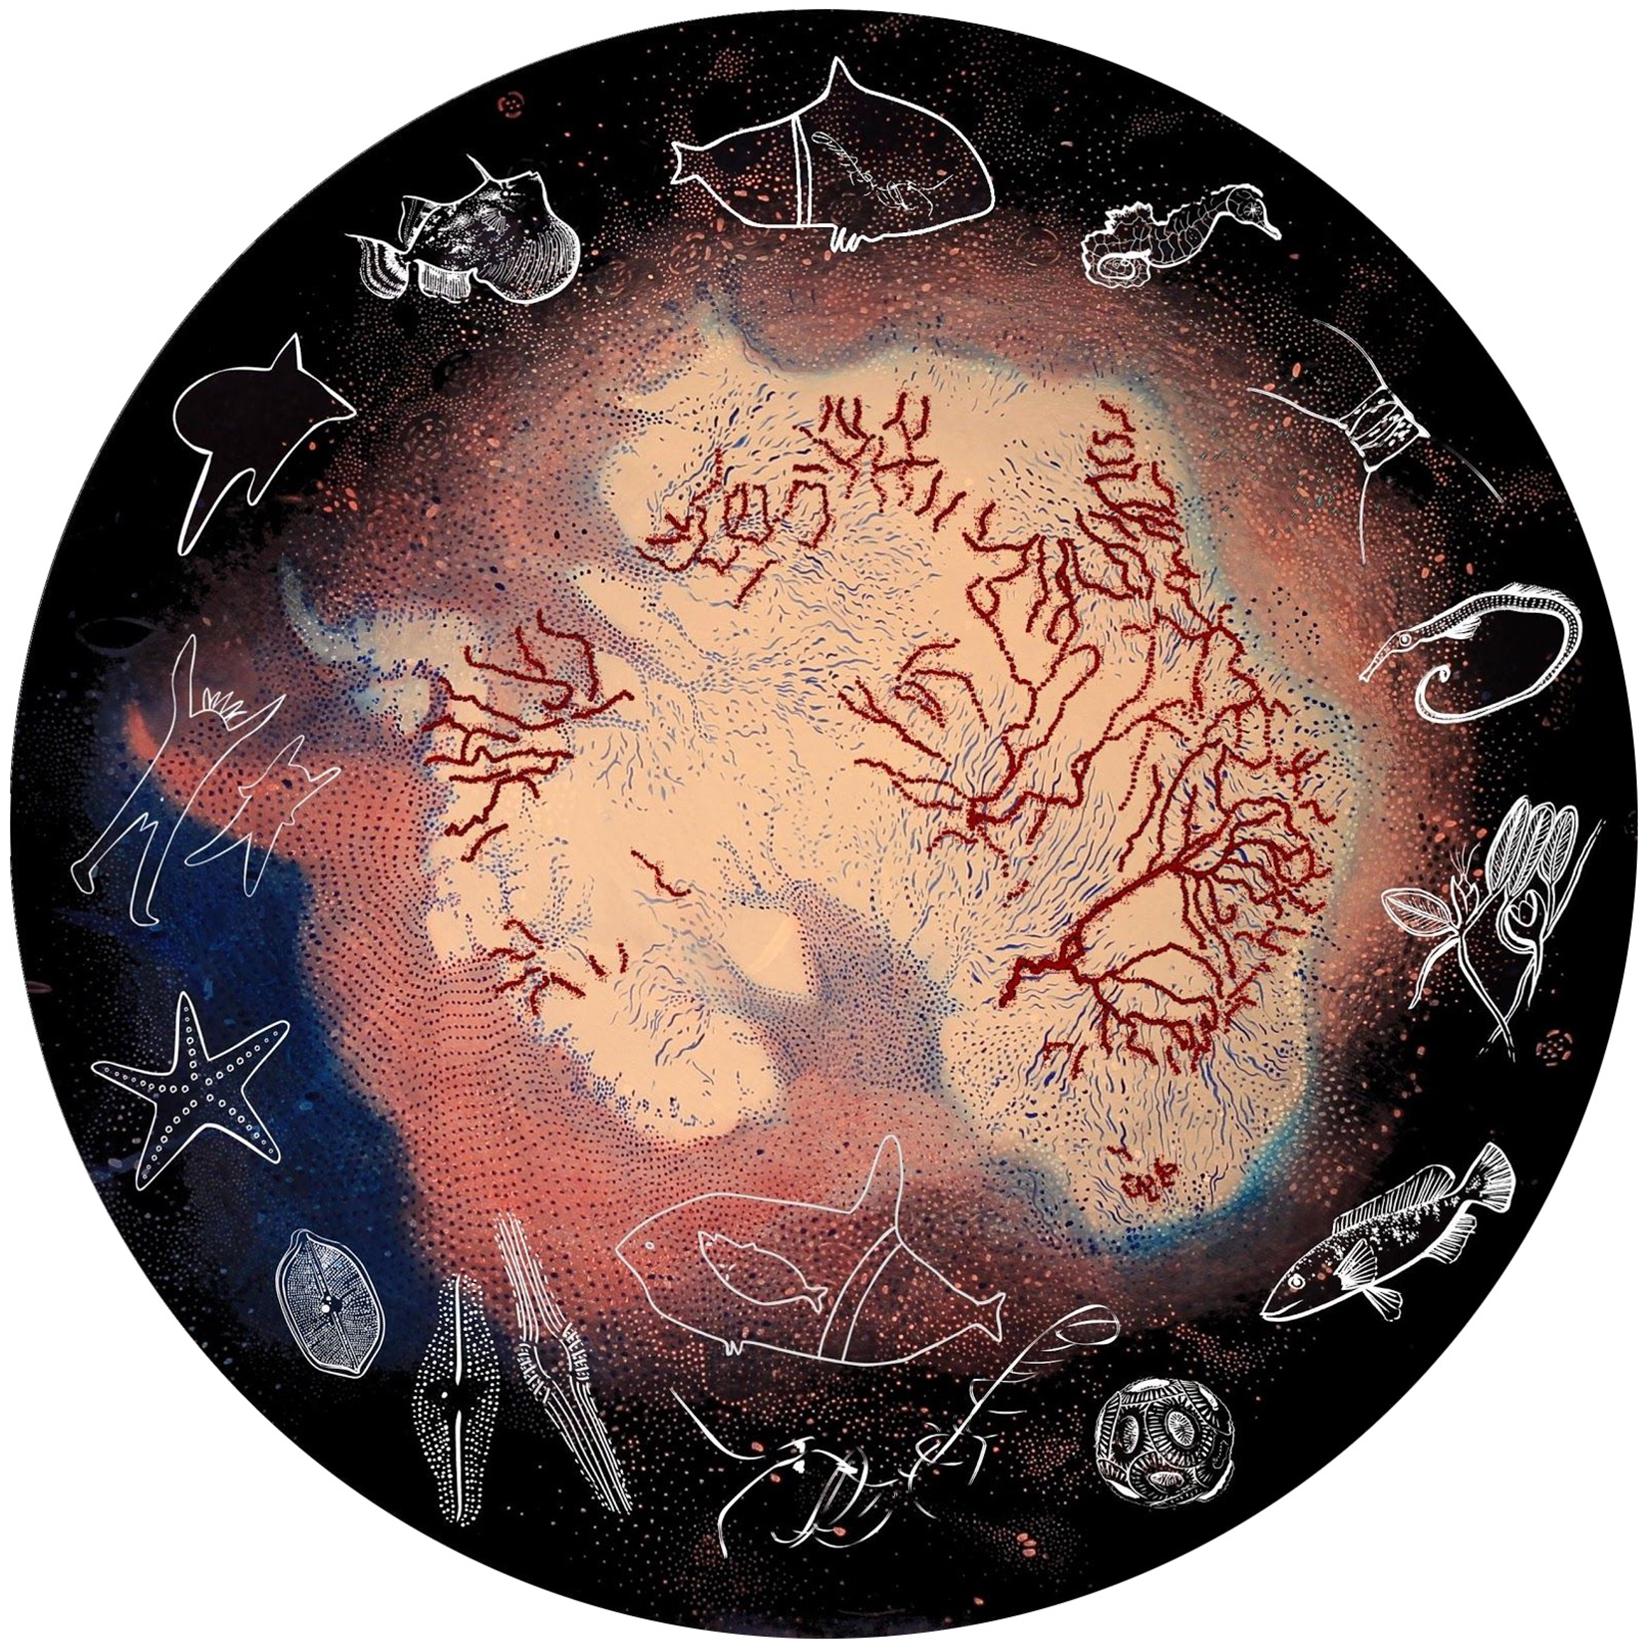
Living Data
Evolving conversations 
University of Technology, Sydney Main Entrance Foyer, 3 Sept 2014 - 20 Nov 2014
In Ultimo Science Festival, Sydney3-12 Sept 2014
 Natalie Mazurek with Tony Baker
How can we visually represent the acidification process occurring in the ocean?
Natalie Mazurek. Acidification dramatised 2014
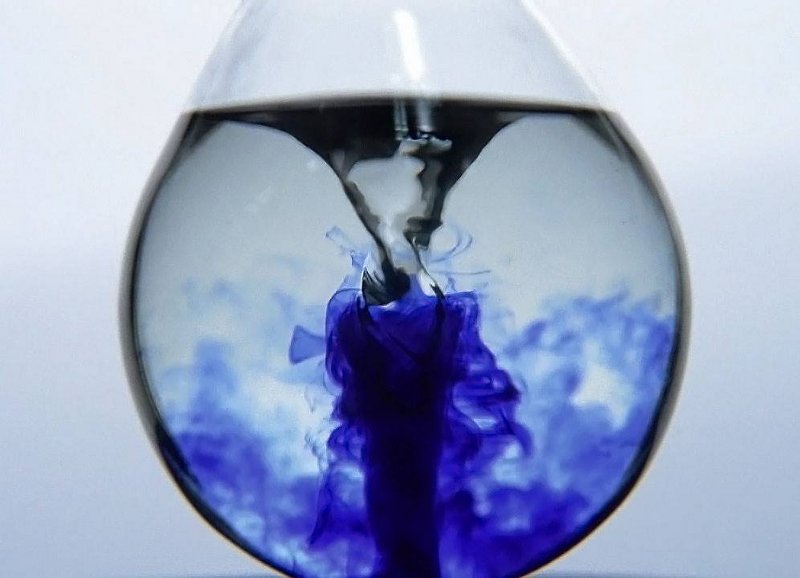
Still from film experiment
Experiment design 01:
Aim: To visually represent the acidification process occurring in the oceans.
Method summary: To bubble CO2 into a beaker of water + indicator + shells (against a black background with underside lighting), changing the colour of the solution from blue to colourless with increasing pH. Shells placed at the bottom of the beaker also dissolve with the increasing pH. The final step is to switch off the underside light, resulting in a completely black screen on the video.
Experiment features:
I've visualised (below) lava lamp style set-up with a black background against an illuminated blue/green solution, colours that I think would nicely represent the mysterious ocean depths. This would be easy to set up as per instructions on: http://thepanekroom.com/tag/saturday-science-sessions/
Thymolphthalein, if attainable, would be my indicator of choice as it goes from an ocean blue colour to colourless. The disappearing colour being representative of marine life unable to adapt to the changes in their environment.
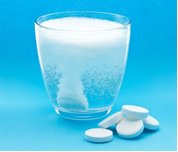
Perhaps we could use Alka-Seltzer tablets to bubble CO2 into the water, by dropping some tablets into another beaker of water and directing the CO2 through a tube into the main beaker. Would this work?
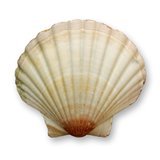
It would be interesting to see the effect of the changing pH on an actual marine creature, and show the dissolution of a calcium carbonate compound (ie. shells; something that looks like coral; or anything else representative that is soluble) placed at the bottom of the main beaker. Feasible?
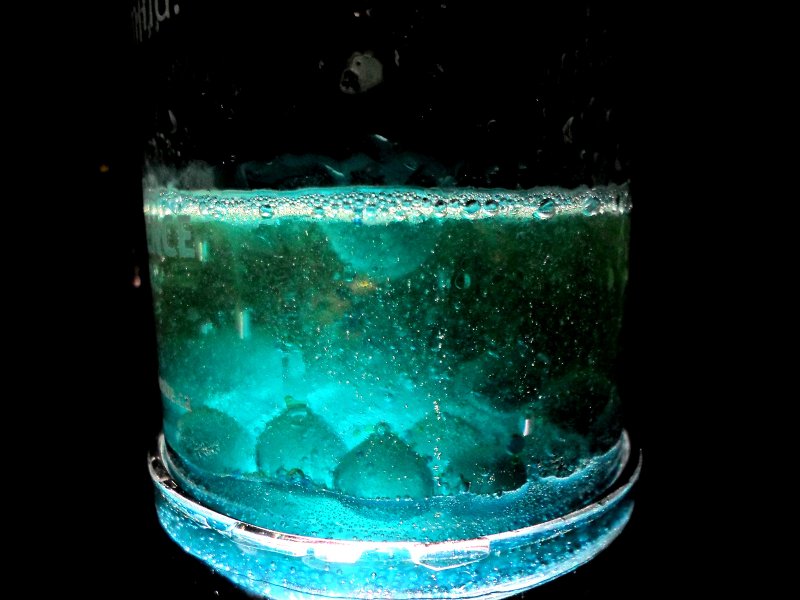
Experiment design 02:
Aim:
To visually represent the acidification process occurring in the ocean.
Method summary:
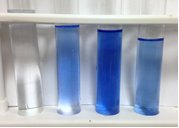
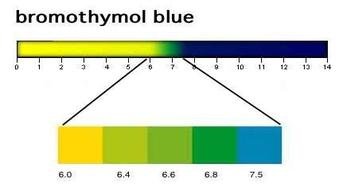
Dropping diluted HCL (5%) onto anhydrous Na2CO3 and directing resulting CO2 via tube into beaker containing water, bromothymol blue and NaOH (and coral).
Introduction of CO2 into the solution causes it to increase in pH and the indicator to change colour from blue to green and finally to yellow.
Coral to be shown as dissolving with increasing pH (whether by chemical reaction or physically breaking down the coral if process is too slow).
One light to be switched off at each colour change. Final step is to switch off remaining light, resulting in a black screen on the video.
Experiment set up:
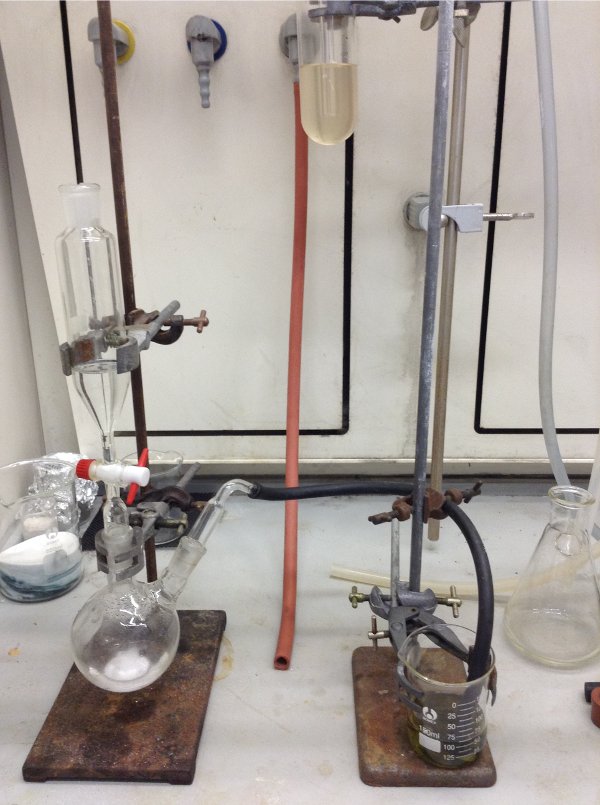
Natalie Masurek with Tony Baker
Acidification process 2014
Set up for filming
Natalie Masurek with Tony Baker
Acidification process 2014
bromothymil blue
Creative set up: Models/ideas
Lava lamp style lighting - black background with lights (ie, LEDs) illuminating tank (round fish bowl or tall rectangular glass vase).
Natalie Mazurek, 2014.