Living Data
Big Picture Story 02:
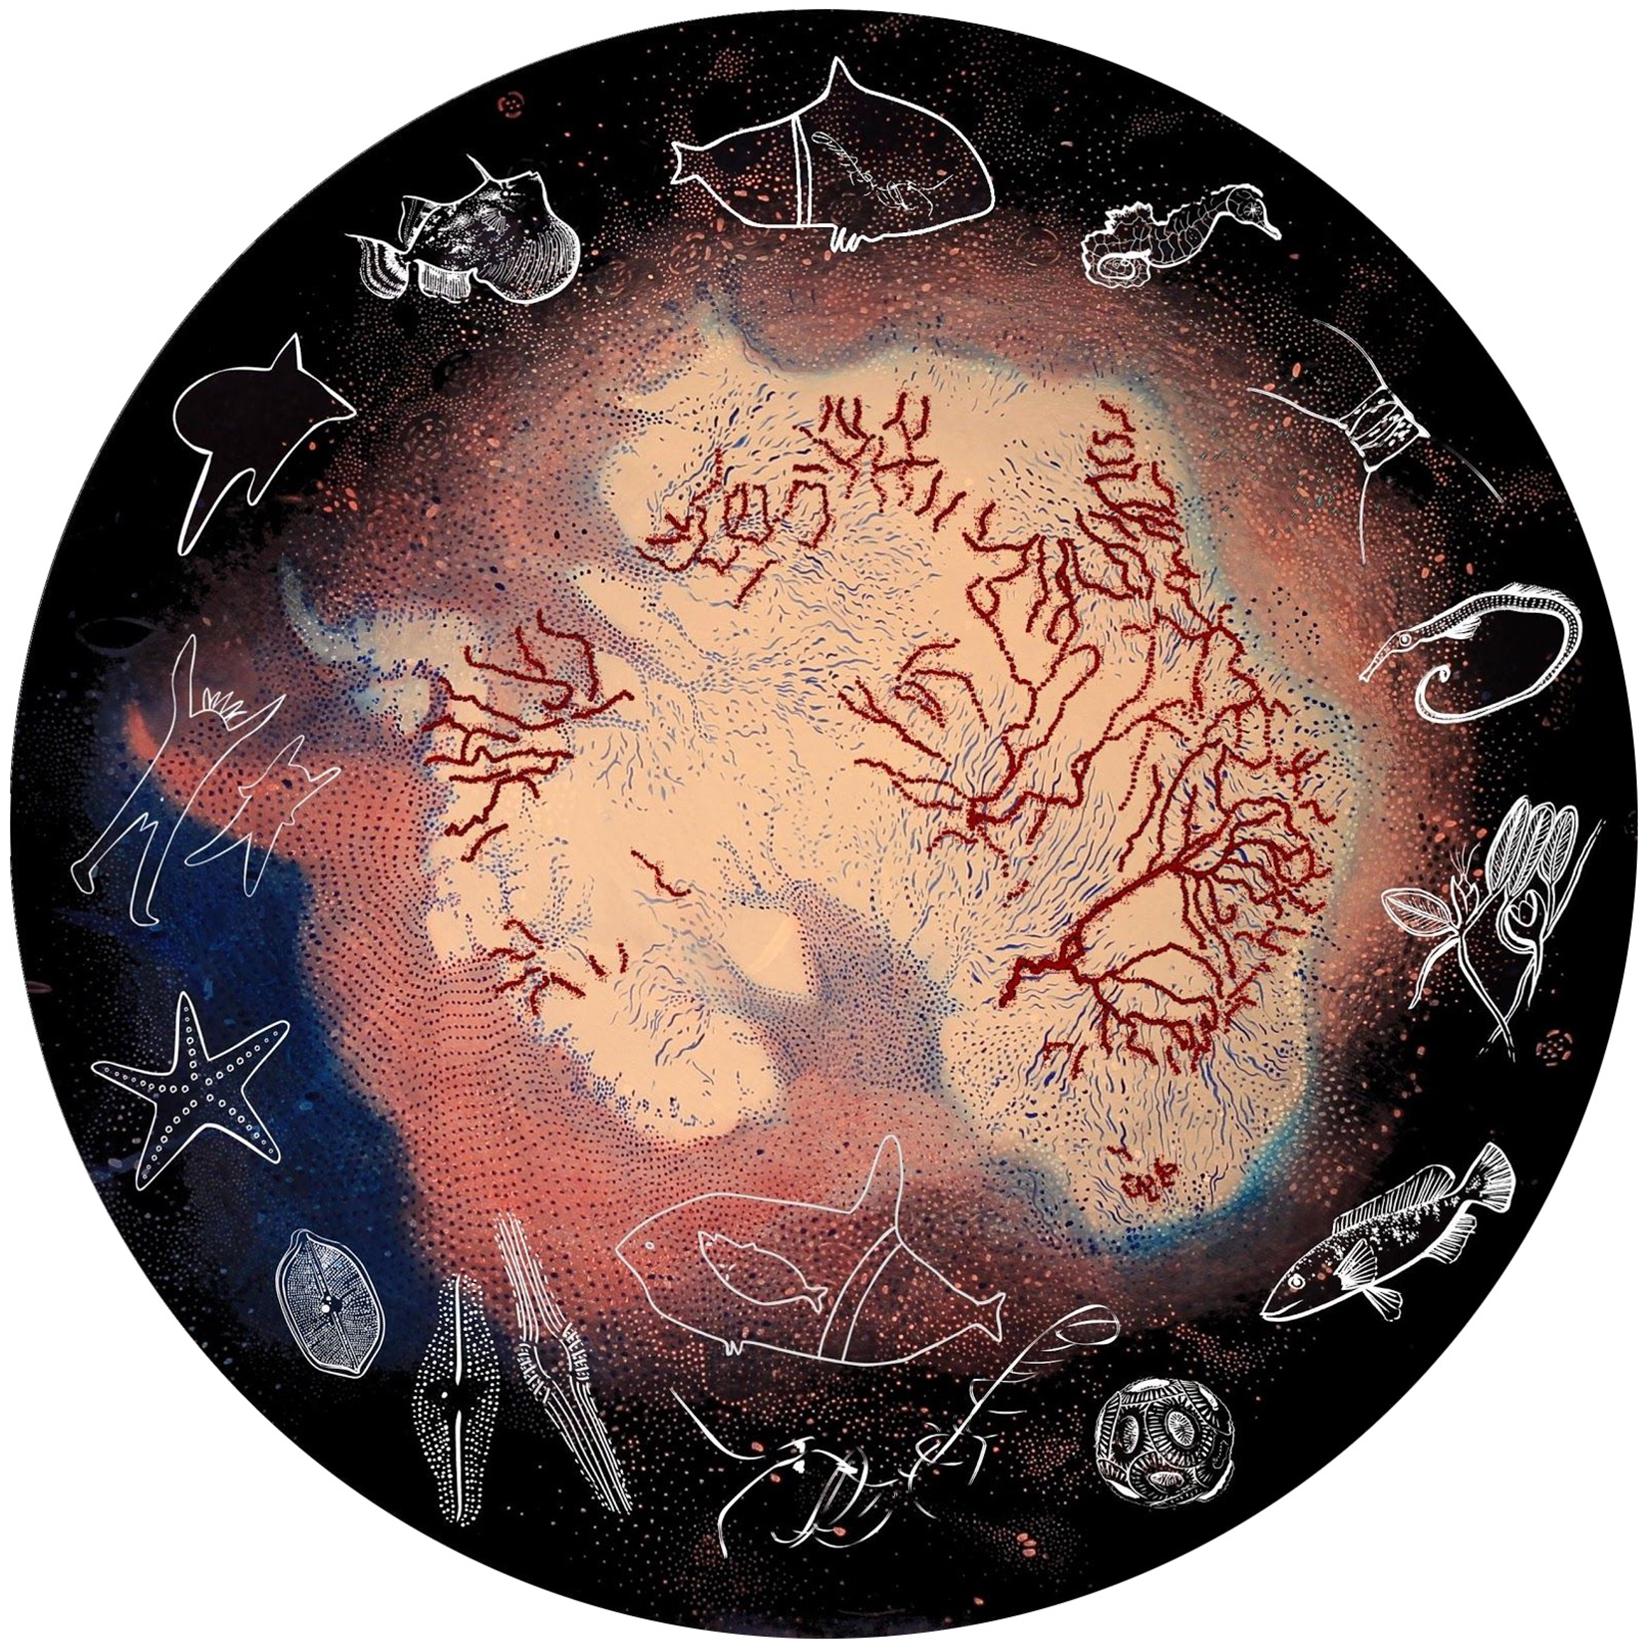
Green planet
Algae appear green because they don't absorb green. They reflect it back... Now if everything is going well they can use some of that light to make sugars, basically, along the photosynthetic chain. If things are going badly they may not be able to use that light at all, in which case it all ends up as heat.
The young Earth, at the time of Life's arrival, was a hostile, highly volcanic world with a poisonous atmosphere that did not contain oxygen but had high Carbon Dioxide levels. It was photosynthesis, first by some Bacteria, then by Algal cells with green pigment (Protists) in the sea, and much later by Plants on land, that created an oxygenated atmosphere. (In photosynthesis, the C02 molecule is split by a special molecule in green pigment, the C used for metabolism, the 02 liberated into water or atmosphere.)
Earth is the GREEN PLANET where the energy for nearly all Life depends on Photosynthesis.
Dr Mary E. White 2012
Light response 2013
Dance/video: Lisa Roberts
Exectutive production: Ken Wilson
The moon is new.
The tide is low.
Algae and other life forms
experience full sun heat.
The algae Hormosira Banksii(Neptune's necklace) is observed at Pearl Beach, NSW, on Friday 8 February 2013.
Increasing variability 2012
Data: Martina Doblin
Concept design: Lisa Robertswith Martina Doblin
Animation: Lisa Roberts
Music: Sophie Green
Animation: Lisa Roberts
Tides that flow over a rock platform at Bilgola (north of Sydney) temporarily cool this habitat of the macro alga Hormosira Bansksii (Neptune's necklace). The cooling flood tides reduce the stress of dessication and high temperature and help regulate the alga's activity and abundance. Wave patterns represent the ebb and flow of tides. Dots are the algae eggs. The central figure is the fertilized embryo and the fronds its adult form (these are not to scale). When the tide is out, the stress of exposure is reflected in the activity and abundance of eggs and embryo, and matches the gentler tempo of the music. The stress and discomfort of algae when heated are expressed as less movement and abundance.

Green algae happiness: Energy producing! 2012
Object (fluorescent acrylic): Lisa Roberts
Data/materials: Jim Franklin
Tiny dots are engraved by hand into green acrylic sheets. The dots trace data from the FRRf (Fast Repetition Fluorometer). The length (x axis) of the green sheet represents a number of microsecond flashes of red light, cast from the FRRf into water. Graphs produced from data gathered by the FRRf represent light 'soundings' at certain depths. The depth recorded here is within the 'sweet spot' (at about 70 m), where most algae live. The height (y axis) of the acrylic sheet represents the levels of light (intensity) emitted from the algae in response to microsecond flashes from the FRRf. The higher the intensity of response from algae (indicated by dots higher on the y axis), the greater is their capacity to photosynthesize - or, as UTS scientist Jim Franklin says, the greater is their Happiness.
The curves of the sheets of acrylic relate to the movements of the sea, and to gestures of the hand that held the sheets as they were heat-shaped. The curves appeal to body memories of being in the sea and to drawing waves. Appeals to body memories of moving through a place are ways to dynamically connect to the data.
Lisa Roberts 2012