Living Data
Animating Change: Exhibition
| Exhibition |
Forum |
Dance |
Interviews |
Impacts |
Stories, hypotheses, data and iconography are combined to make sense of climate change.
An Ultimo Science Festivalevent at The Muse, Ultimo TAFE, Sydney, 16 - 26 August 2012
Project leader: Lisa Roberts Exhibition curators: Christine McMillanand Lisa Roberts
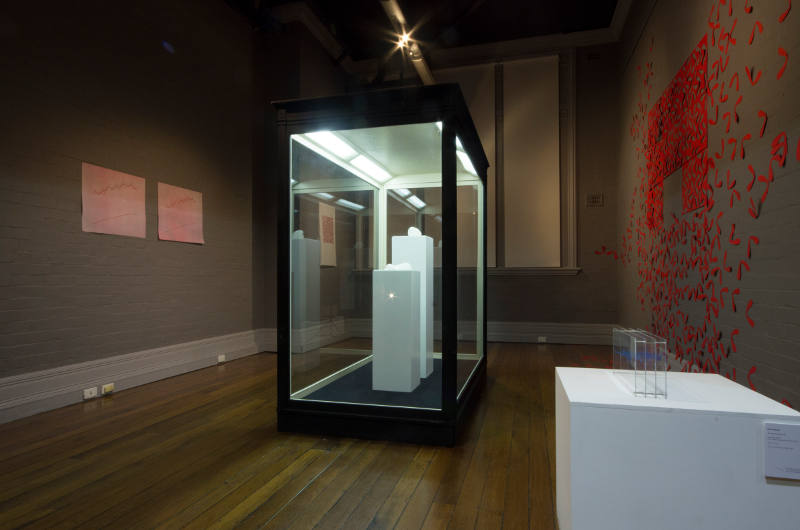
DissolveInstallation. Melissa Smith 2012.
with Sea levels risingModel. Lisa Roberts (right)
Photo: Stephen Pierce
Combining stories, hypotheses, data and iconography
An Ultimo Science Festivalevent at The Muse, Ultimo TAFE, Sydney, 16 - 26 August 2012
Curators: Christine McMillanand Lisa Roberts
Presentations INDEX / COMMENTS
New technologies increasingly expand methods used in art and science to make sense of our changing environment. Dissolve explores new digital technologies to make 2D and 3D prints. This installation contributes an empathic response to otherwise purely scientific observations.
Catalysts for the print experiments were an invitation to install new work at SAWTOOTH ARI in Launceston, Tasmania, and reading the paper, Krill looks and feelers: a dialogue on expanding perceptions of climate change data (Roberts & Nicol, 2011). The paper introduced me to a most exquisite life form: the Pteropod, commonly known as the Sea Butterfly. This mollusc is an icon of environmental fragility. As well as being a vital link in the marine food web, it plays a major role in regulating levels of C02 that fall into oceans from our massive burning of fossil fuels. As their shells become thin and brittle, their very existence is threatened. My research led to collaborating with scientist Donna Roberts from the Antarctic Climate and Ecosystems Cooperative Research Centre (ACECRC), Hobart, and other scientists from the Australian National University (ANU), Canberra.
Data: Donna Roberts (ACECRC)
Technology/engineering: Jodie Bradby, Dept of Electronic Materials Engineering in the Research School of Physics and Engineering and Timothy Senden, Department of Applied Mathematics, Research School of Physics and Engineering (ANU); Anthony Crawford - Design and Technology department, Scotch Oakburn College, Launceston, Tasmania, in association with the School of Architecture, University of Tasmania, Launceston
Reference:
2011. The Polar Journal, DOI: 10.1080/2154896X.2011.626628. Authors: Roberts, L. & Nicol, S.
Melissa Smith Roving curator with Arts Tasmania, August 2012
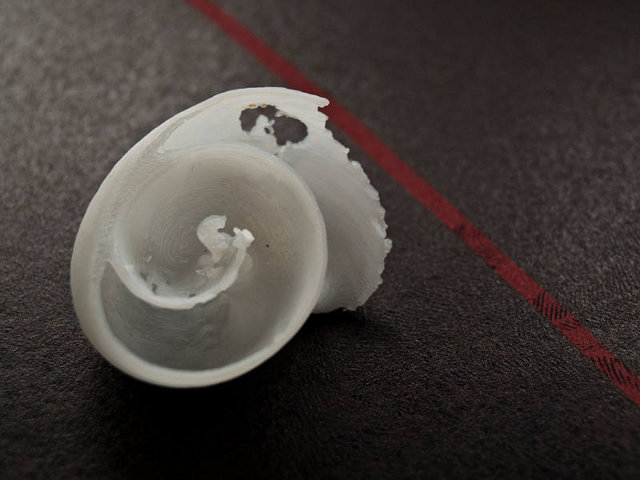
>Dissolve
3D Polylactide print
Dimensions variable
Photo: Melissa Smith
A modified 3D scan of an actual sea-butterfly shell collected by Dr. Donna Roberts in Antarctica waters in 2012.
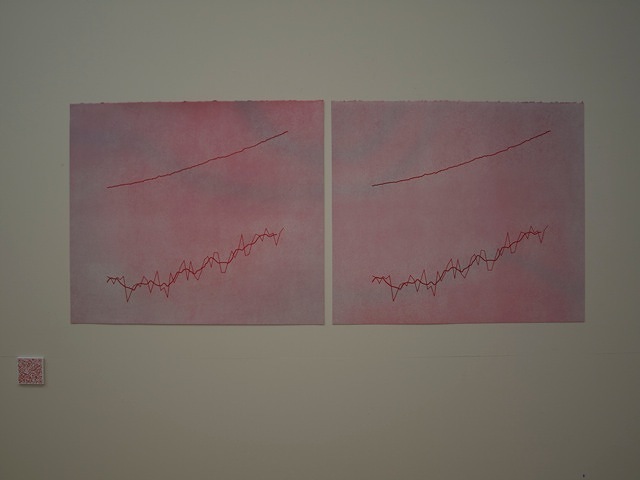
Evil twin 2012
CNC Router lino cut print on BFK Rives
56cm x 76cm diptych
Photo: Melissa Smith
Ocean acidification is described as the Evil Twin of climate change. Greenhouse gases are doing more than just warming the globe. Increasing CO2 levels are also changing the chemical make-up of the oceans. The top line represents the increasing level of carbon dioxide concentration and the two bottom lines represent the global temperature anomaly - one the annual average and the other the 5 year average...all three lines indicate an increase over the past 50 years.
Melissa supplies the link to the Earth Observatory website. Here graphs by Robert Simmon can be found that use CO2 data from the NOAA Earth System Research Laboratory and temperature data from the Goddard Institute for Space Studies: http://earthobservatory.nasa.gov/Features/CarbonCycle/page5.php [Accessed 5 September 2012]
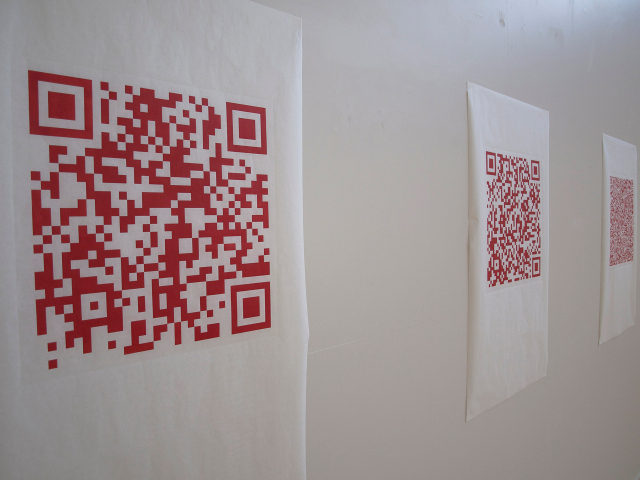
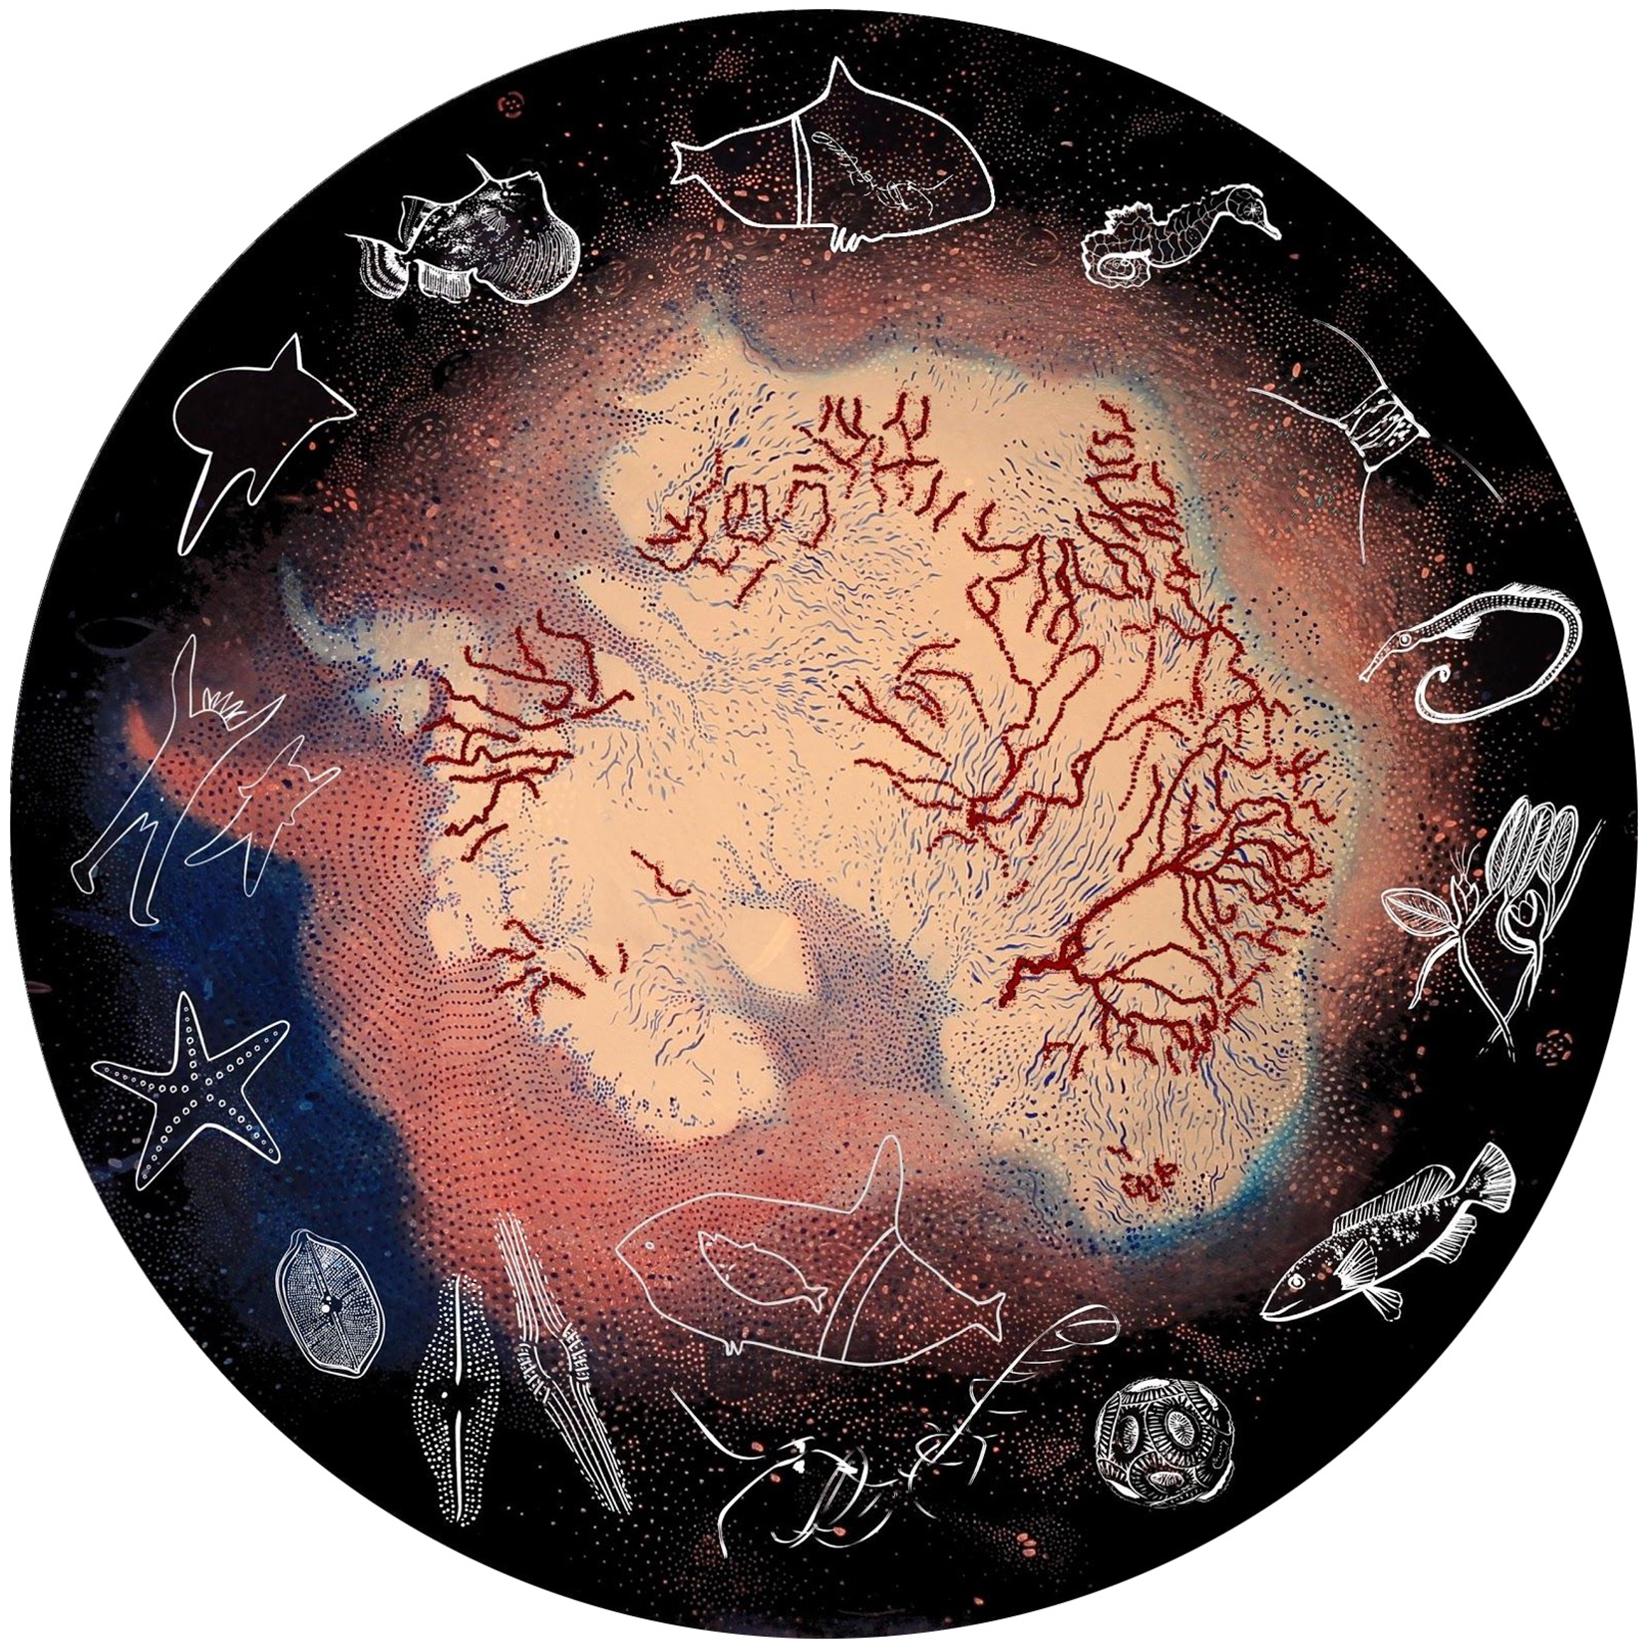
Icon of fragility 2012
QR generated code relief print on rice paper
92.5cm x 58.5cm
Photo: Melissa Smith
Read with a QR Code reader to access a piece of text from the paper Krill looks and feelers: a dialogue on expanding perceptions of climate change data, Roberts & Nicol, The Polar Journal, Vol.1, Issue 2, 2011, pp.251- 264.
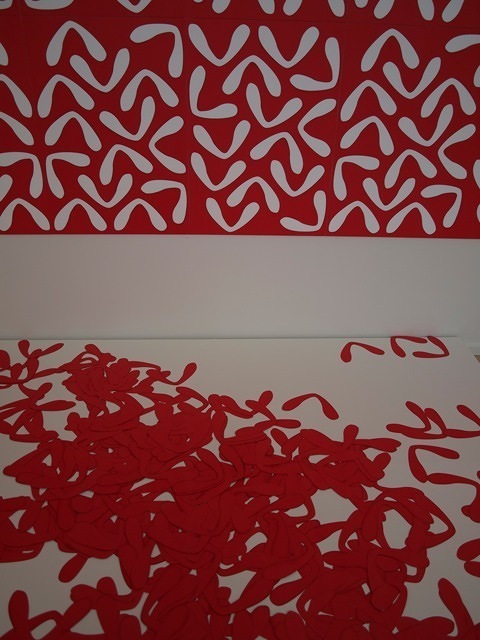
Null and Void 2012
Laser cut paper
Dimensions variable
Photo: Melissa Smith
This work represents the potential loss of the sea-butterfly. As the shells of the winged mollusc dissolve in increasingly acidic waters it becomes increasing threatened. The negative shapes represent this void.
Dissolve is recognised in the field of print media through exhibitions, awards and reviews. This recognition introduces new audiences to current scientific knowledge. Damien Quilliam, Curator of Contemporary Australian Art at Launceston's Queen Victoria Museum and Art Gallery, Tasmania, reviews the SAWTOOTH ARI installation in IMPRINT magazine's 2012 September issue, p.23 (Pub. Print Council of Australia). The 3D print, Dissolve was a finalist in The Waterhouse Prize South Australian Museum, Adelaide, August - September 2012. The QR code print Under threat was a finalist in the Fremantle Print Award Freemantle Arts Centre, 22 September - 8 November 2012.

Sea levels rising #01 2007
Engraved Perspex
(2 sheets mounted in metal thread)
360mmx175mmx62mm
Photo: Lisa Roberts
In 2002 John Church led the major research program on the Australian Antarctic Division's Voyage 7, which I accompanied as an Arts Fellow. We arrived at the Amery Ice Shelf on the day George Bush and John Howard announced that they would not ratify the Kyoto Protocol. Conversations I had with John and other scientists on board convinced me there was much work to be done to raise public awareness of climate change. Sea levels rising #01 is an early example of work I made for exhibition as visual evidence of change. It shows seal levels rising on the coast of Townsville, Australia, from 1920 to 2000. As John explains,
The most important reason for sea level rise in the 20th century, and we expect to be in the 21st century, is oceans thermal expansion. As the ocean warms the water expands, sea level rises.
The second largest contribution is from the melting of glaciers and ice caps, so these are glaciers in places like Alaska, the Himalayas, New Zealand, Switzerland, etc., and they've been melting, and melting an increasing rate over the past 50 years.
And the third contribution, and potentially the largest contribution on the longer timeframe, but we don't think there's been a large contribution in the last century, are the ice sheets of Greenland and Antarctica. Greenland contains enough water to raise sea levels by about seven metres, and Antarctica over 60 metres.
John Church, 2007
CSIRO transcript: Sea level on the rise