Living Data
Circumpolar view
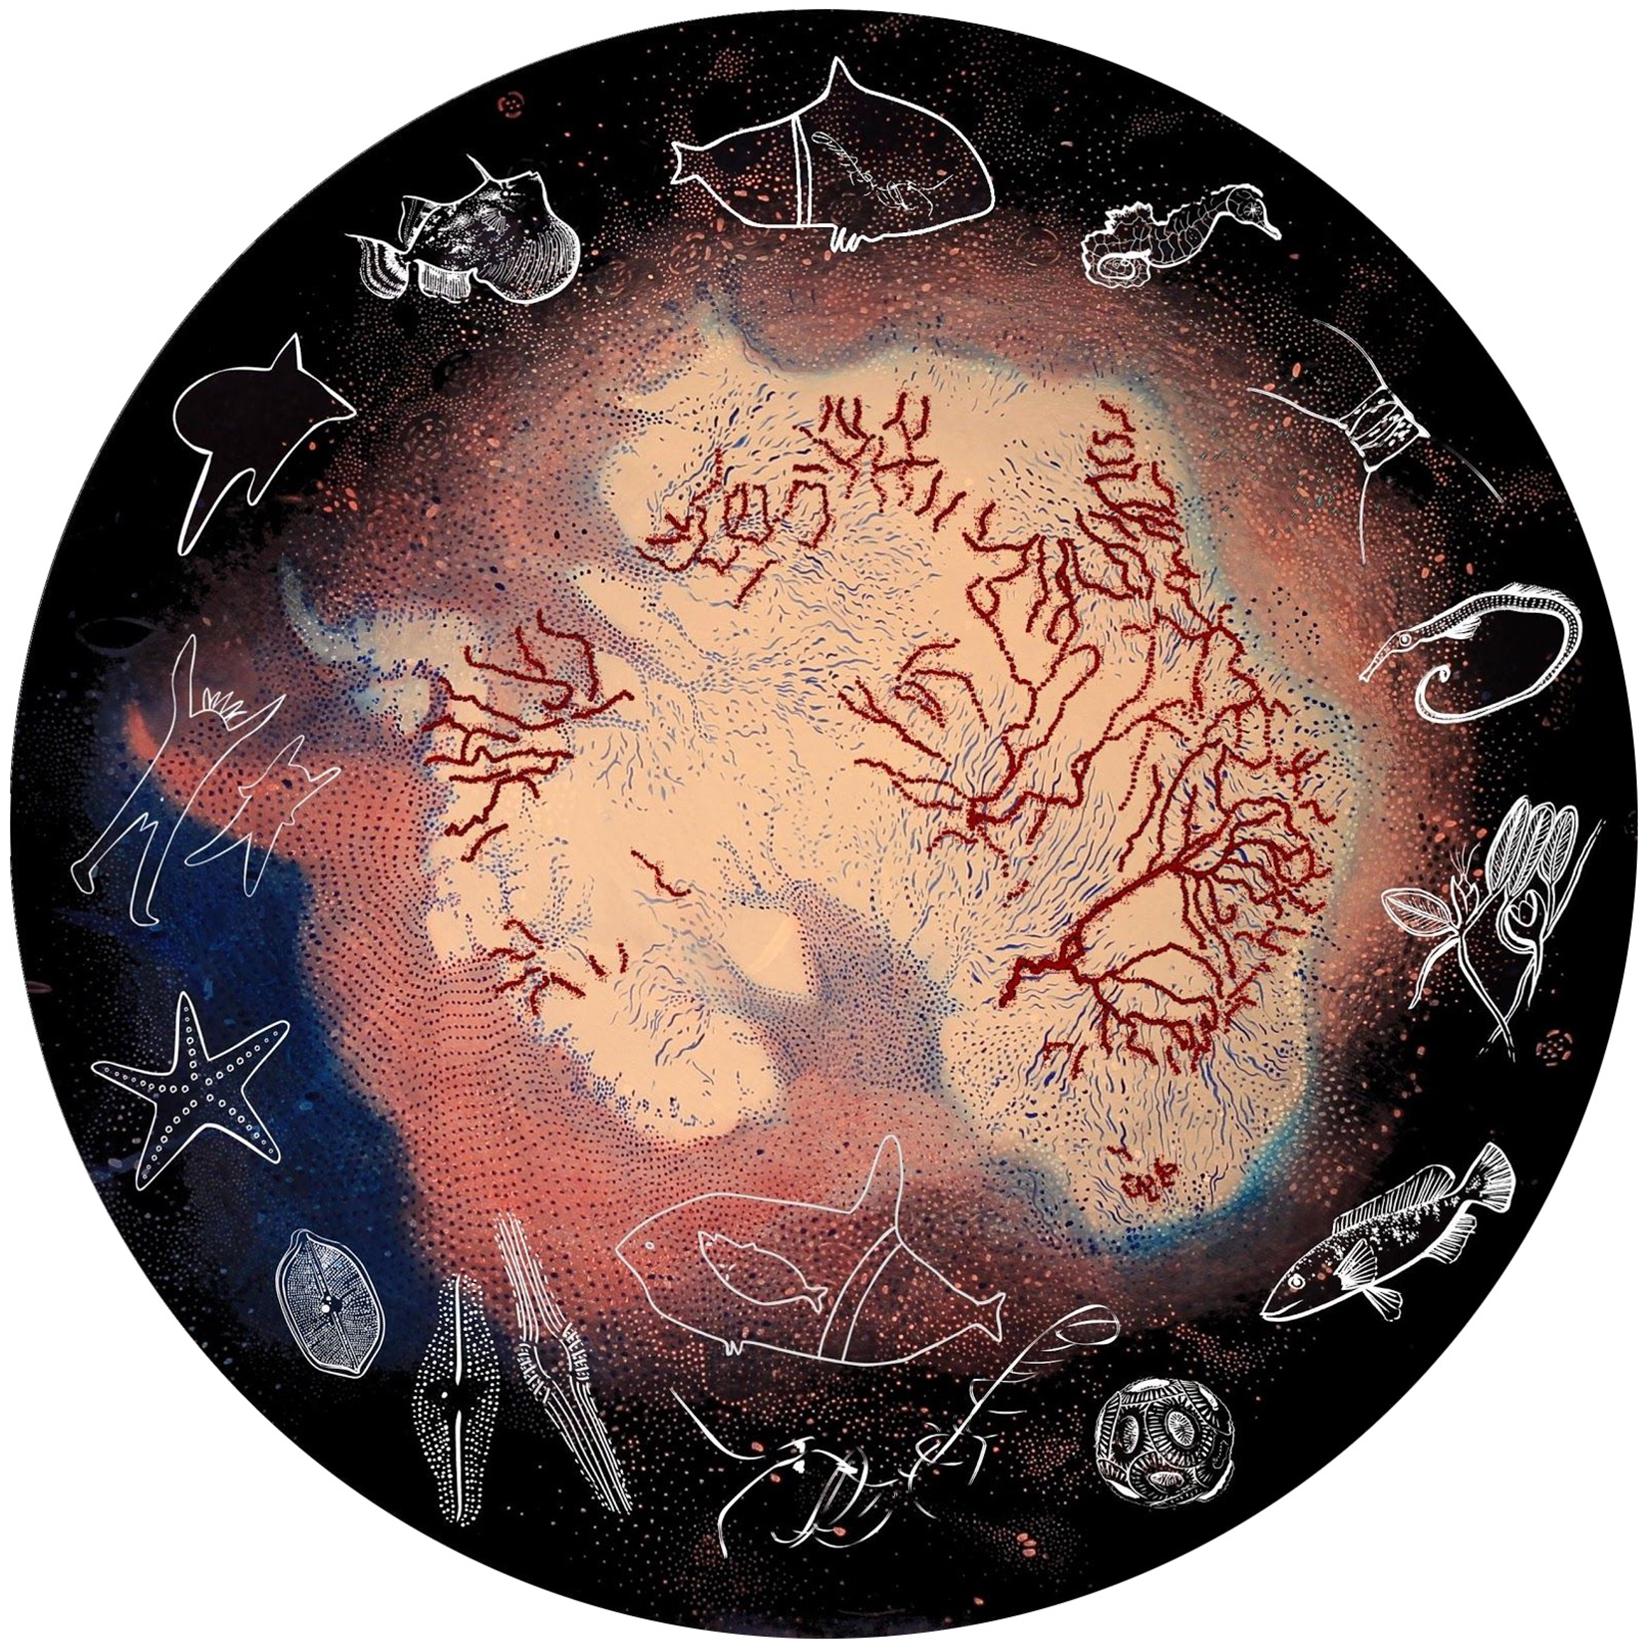
Lisa Roberts Circumpolar view Animation 2011
Data: Australian Antarctic Division
Music: Sophie Green
Production assistance: Ken Wilson
Advisors: Vikki Quill, Irene Schroder
Data recorded from satellites reveal a dynamic global system of ocean circulation that is driven by the Antarctic circumpolar current. Data are traced and combined with the gestural forms of treading feet and circling, spiralling lines, that were developed for the animation We drift towards the things we cannot have. In Circumpolar view human foot prints tread into Antarctica, around which flow the circling, spiralling currents that drive the global system.
Although we may use digital imaging technologies to view our impacts on the environment, we continue to use primal forms to express our relationship to it. Foot prints and circular, spiralling forms are recognized in prehistoric paintings and in the art of small children. A circle may not always express connection. It can also express isolation. Here the circle signifies the biosphere and the complex human condition. Spirals can signify seemingly contradictory and complex physical systems that we may associate with feelings. Outwardly moving spirals describe energy increasing. Inwardly moving spirals describe energy dissipating.
Here the southern hemisphere is visualised. How can the whole ocean system be shown? Ken Wilson suggests that the northern hemisphere be visualised sliced open like the peel of an orange and added to the animation.